Amazon's capital spending hit US$131.8bn in 2025
Free, six mornings a week · Unsubscribe in one click

What the chart shows
Three of the companies on this chart report this week: Alphabet and Microsoft after Wednesday's close in New York, Amazon on Thursday.
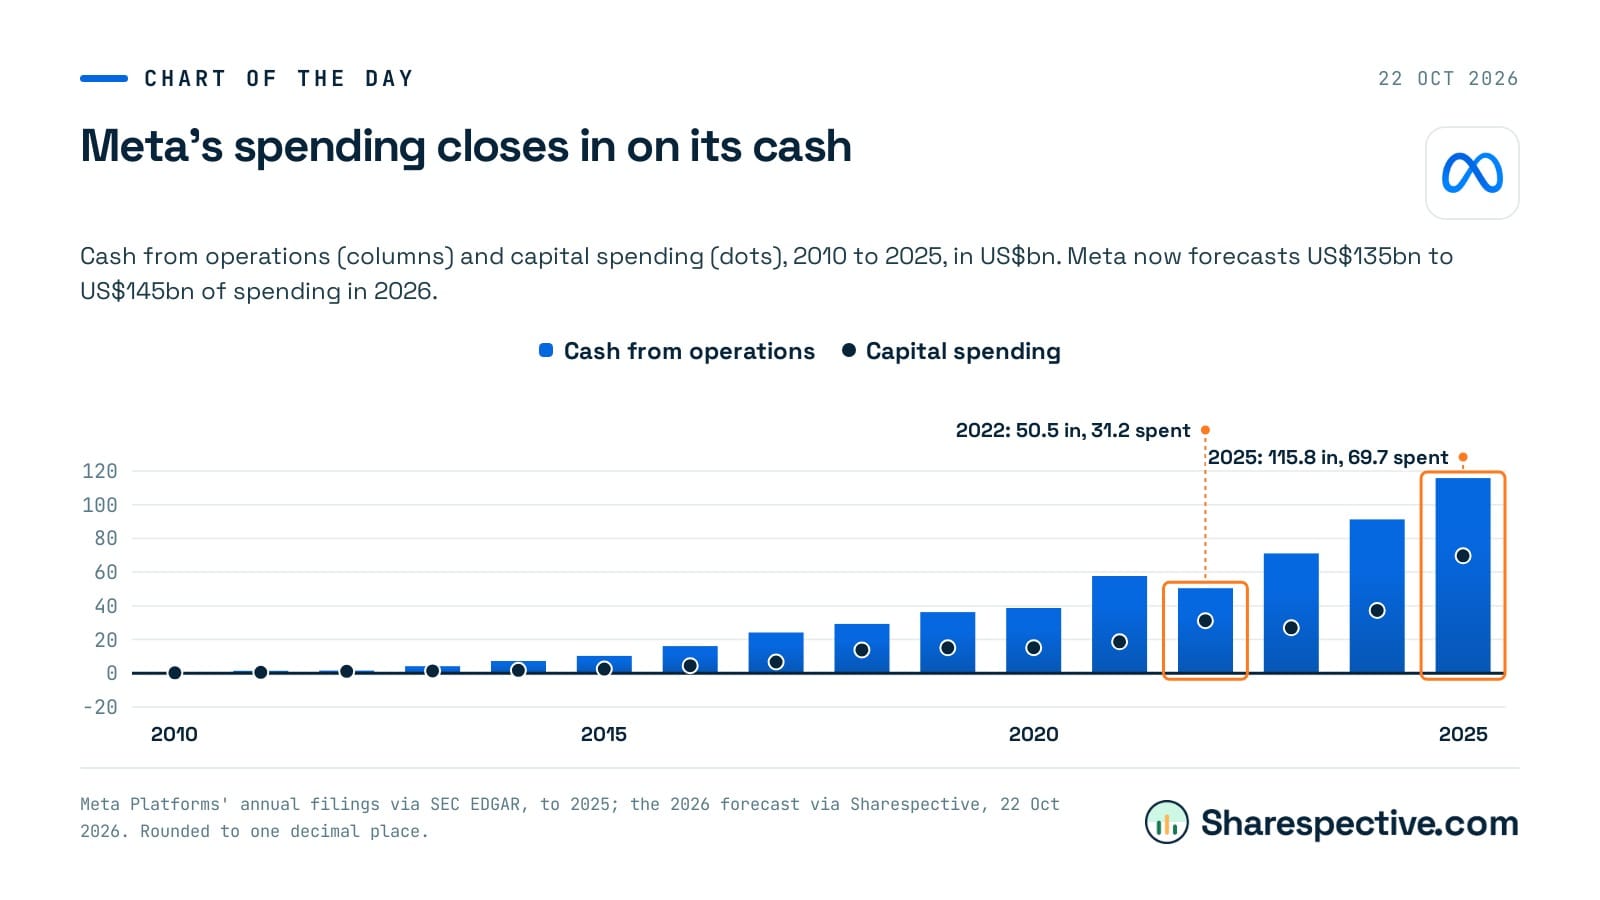
In 2016 Amazon spent US$7.8bn on property and equipment. In 2025 it spent US$131.8bn. Alphabet's spending went from US$10.2bn to US$91.4bn over the same years, and Meta's from US$4.5bn to US$69.7bn. Microsoft keeps a year to June, and in the year to June 2026 it spent US$115.9bn.
Alphabet has told investors to expect US$195bn to US$205bn of spending this year. Monday's Sharespective set the test for the results as cloud revenue growing faster than the bill.
The story behind it
Alphabet, Microsoft and Amazon report this week, with about US$600 billion of spending to explain Read the edition →Microsoft on the calendar
Next results: date to come. It goes on the calendar as soon as Microsoft announces it. Economic calendar →The numbers
Cash spent on property and equipment each year, in US$bn, 2016 to 2025; Microsoft's years end in June. Alphabet expects to spend US$195bn to US$205bn in 2026.
| Amazon | Alphabet | Microsoft (years to June) | Meta | |
|---|---|---|---|---|
| 2016 | 7.8 | 10.2 | 8.3 | 4.5 |
| 2017 | 12.0 | 13.2 | 8.1 | 6.7 |
| 2018 | 13.4 | 25.1 | 11.6 | 13.9 |
| 2019 | 16.9 | 23.5 | 13.9 | 15.1 |
| 2020 | 40.1 | 22.3 | 15.4 | 15.2 |
| 2021 | 61.1 | 24.6 | 20.6 | 18.7 |
| 2022 | 63.6 | 31.5 | 23.9 | 31.2 |
| 2023 | 52.7 | 32.3 | 28.1 | 27.0 |
| 2024 | 83.0 | 52.5 | 44.5 | 37.3 |
| 2025 | 131.8 | 91.4 | 64.6 | 69.7 |
How we make these charts: one chart a day from a story in the edition, drawn from the figures the story names and checked against the sources named on the chart before it is published. General information only, not financial advice.