The chart behind this morning’s edition.
One chart a day from a story in the edition, drawn from the figures it names and checked against their sources. Every chart since 5 September, in one place.
Free, six mornings a week · Unsubscribe in one click
Today’s chart
Consulting · from Friday’s edition
What it shows
For two years the market has been marking Accenture down while its revenue went up. At the end of August it was worth US$116.1bn, against US$214.2bn two years before. Revenue in the financial year just ended was US$74.2bn, up from US$69.7bn.
The worry was simple: Accenture sells people's time, and AI tools might do much of that work. The chart puts five years of sales beside what investors paid for the business at each year end, revenue on the left scale and market value on the right.
The numbers
| Revenue, US$bn | Market value, US$bn | |
|---|---|---|
| FY22 | 61.6 | 182.5 |
| FY23 | 64.1 | 204.2 |
| FY24 | 64.9 | 214.2 |
| FY25 | 69.7 | 161.9 |
| FY26 | 74.2 | 116.1 |
Every chart
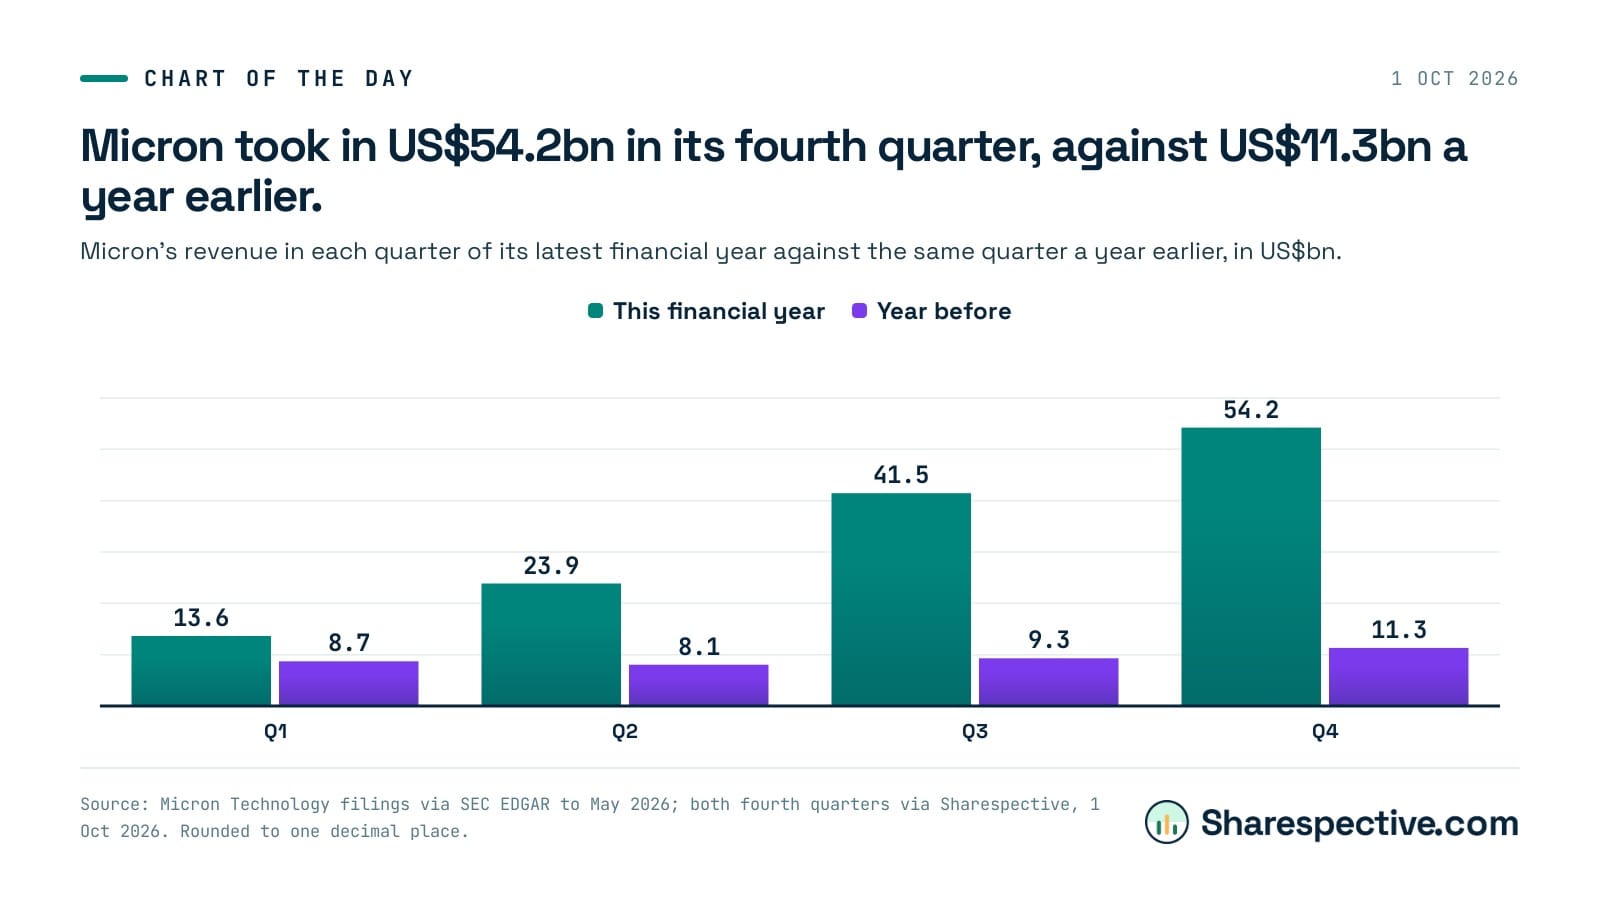 Micron took in US$54.2bn in its fourth quarter, against US$11.3bn a year earlier
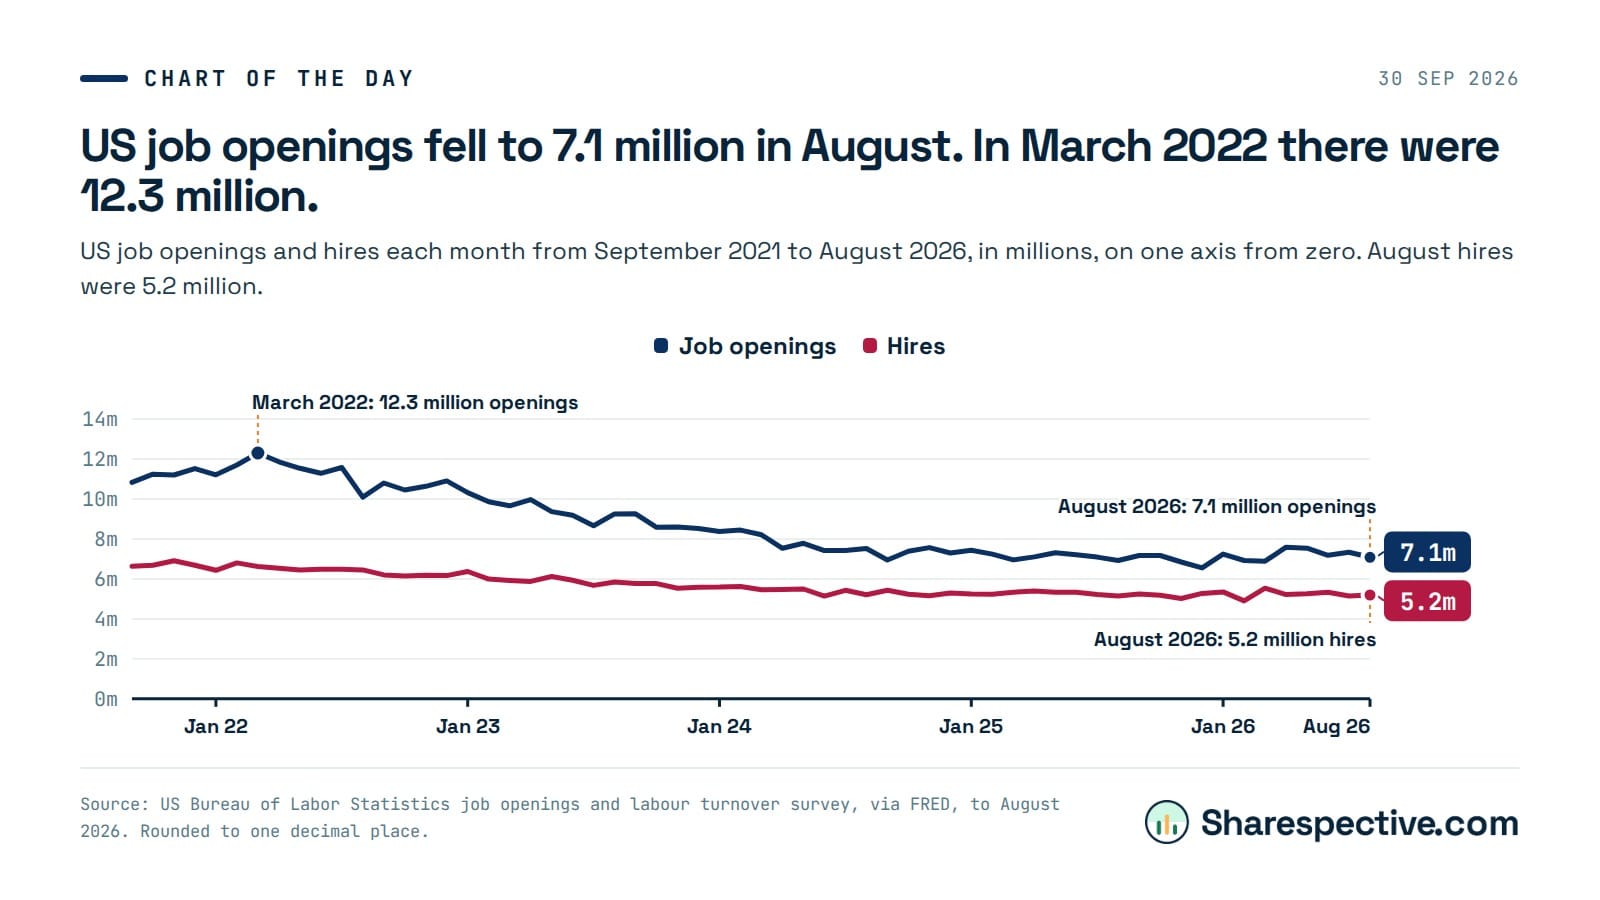 US job openings fell to 7.1 million in August. In March 2022 there were 12.3 million
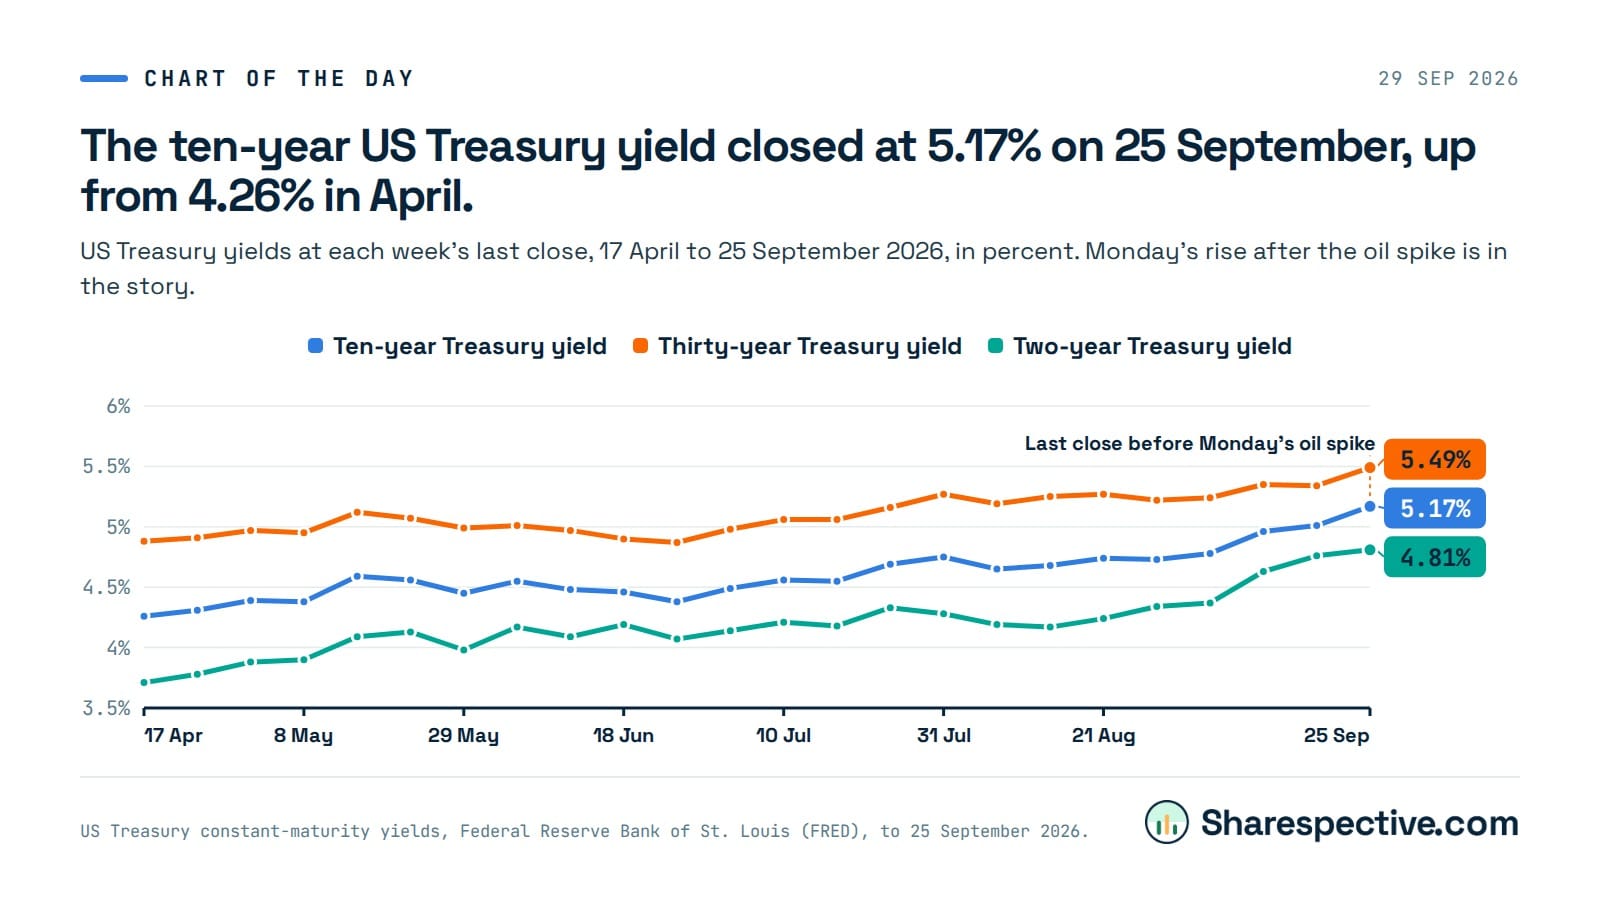 The ten-year US Treasury yield closed at 5.17% on 25 September, up from 4.26% in April
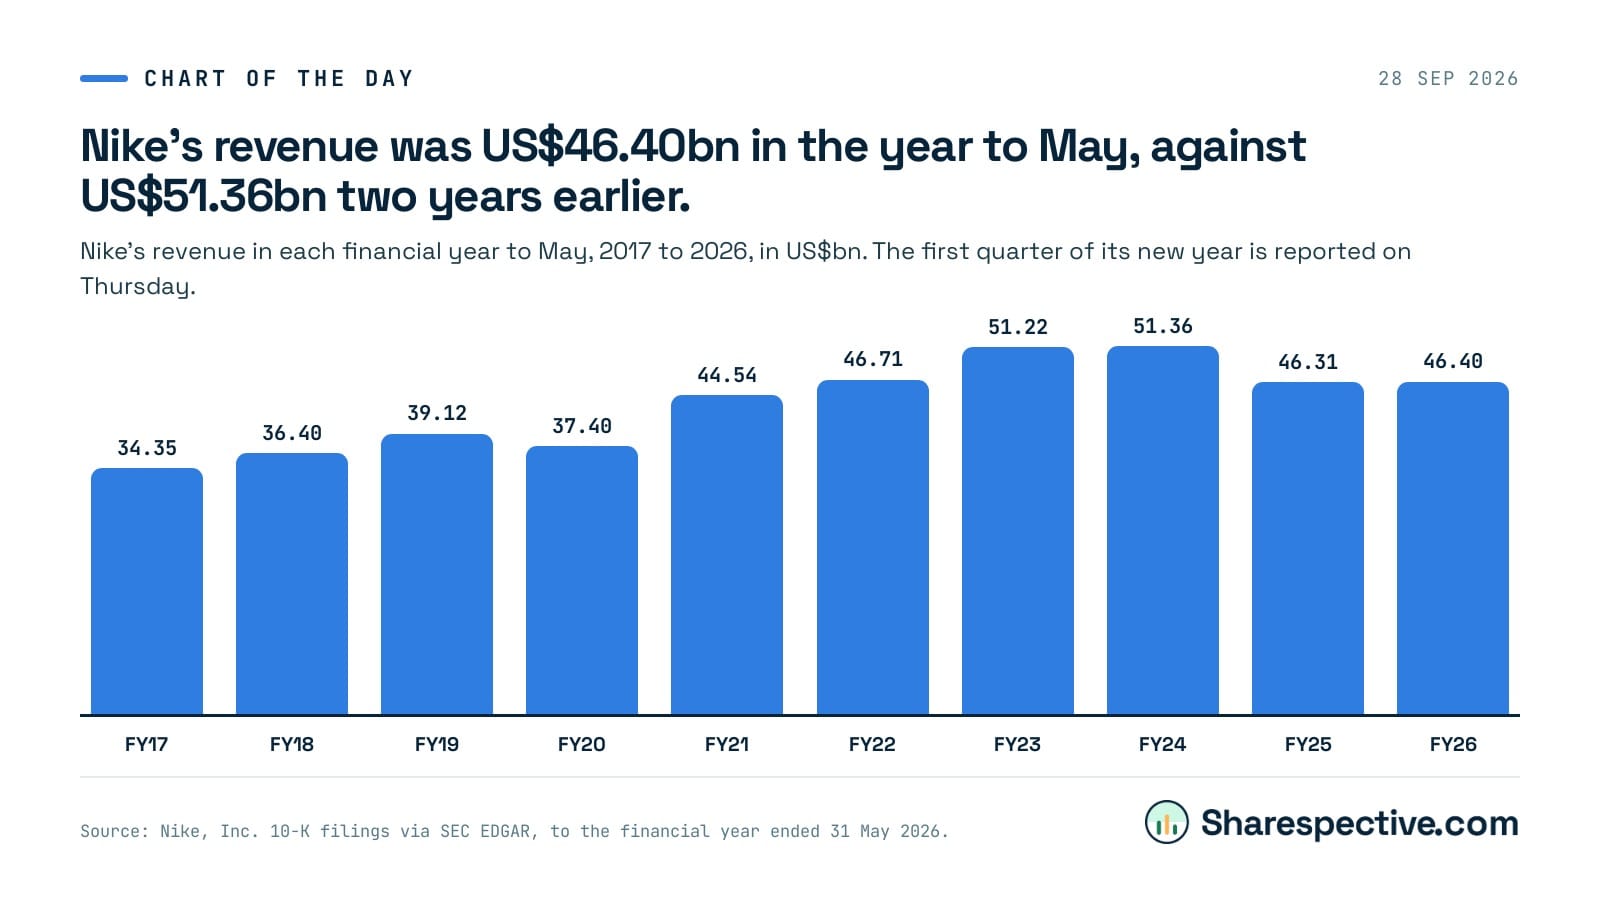 Nike's revenue was US$46.40bn in the year to May, against US$51.36bn two years earlier
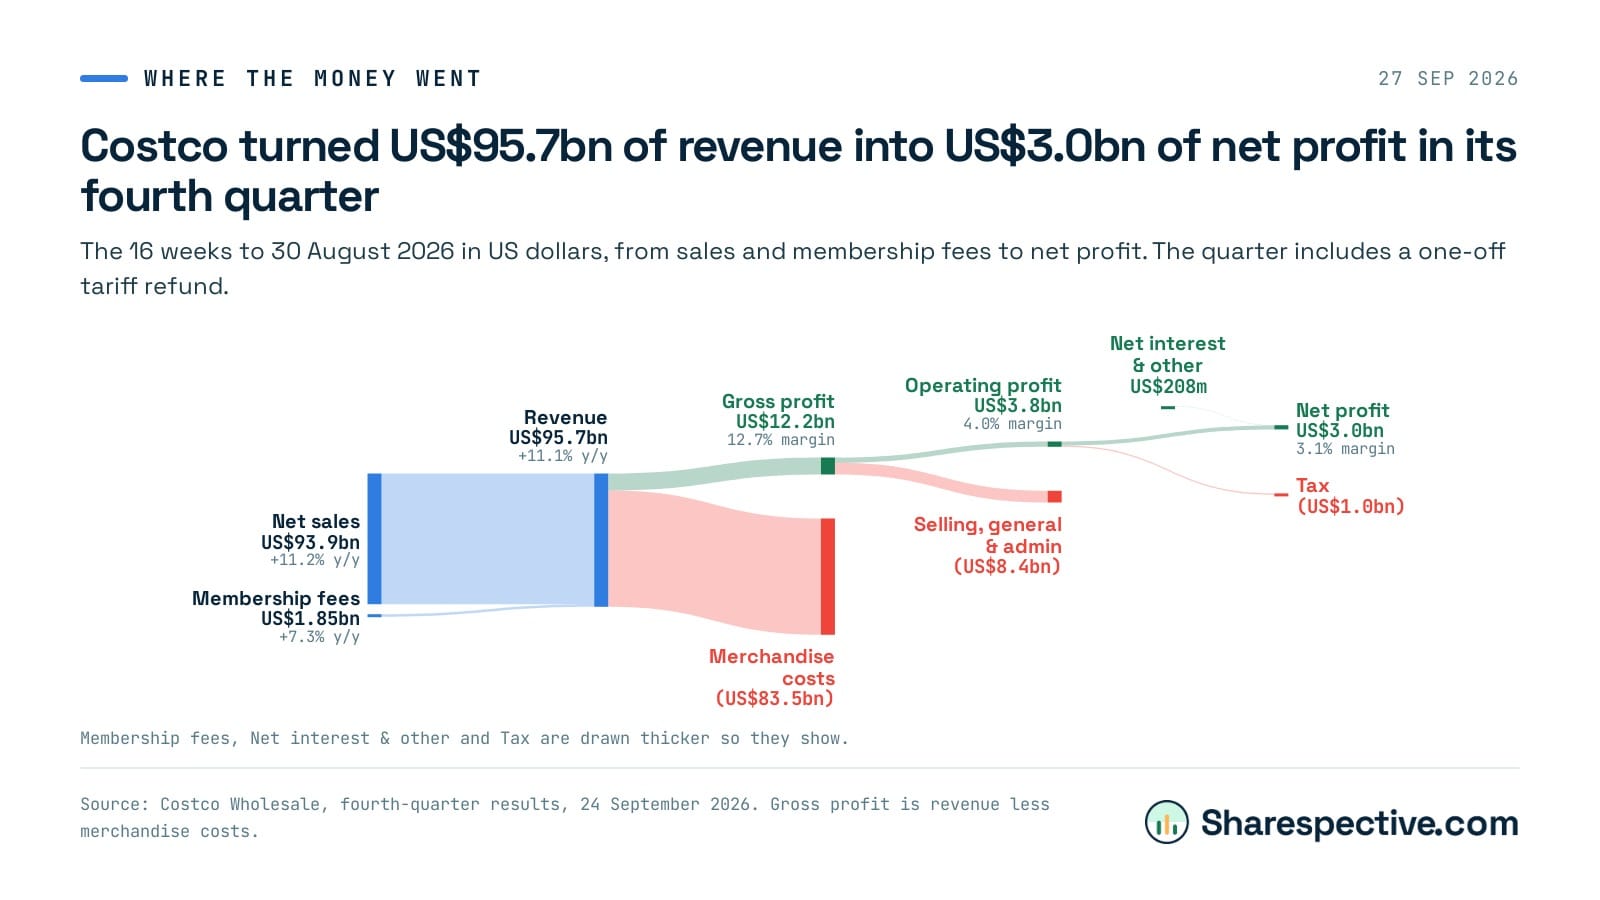 Costco turned US$95.7bn of revenue into US$3.0bn of net profit in its fourth quarter
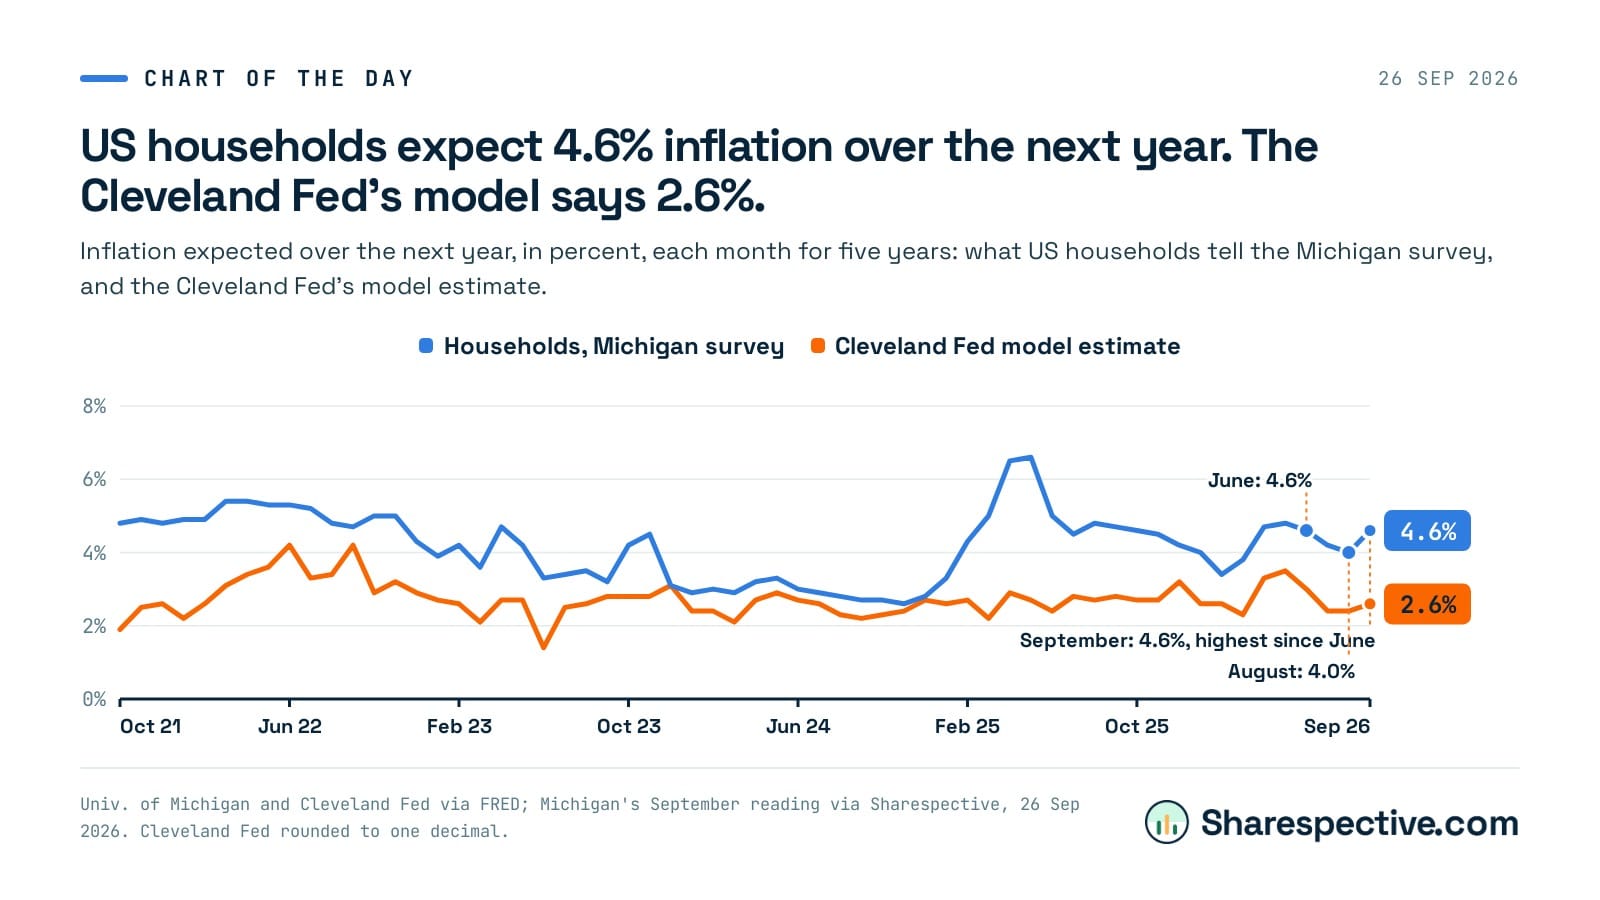 US households expect 4.6% inflation over the next year. The Cleveland Fed's model says 2.6%
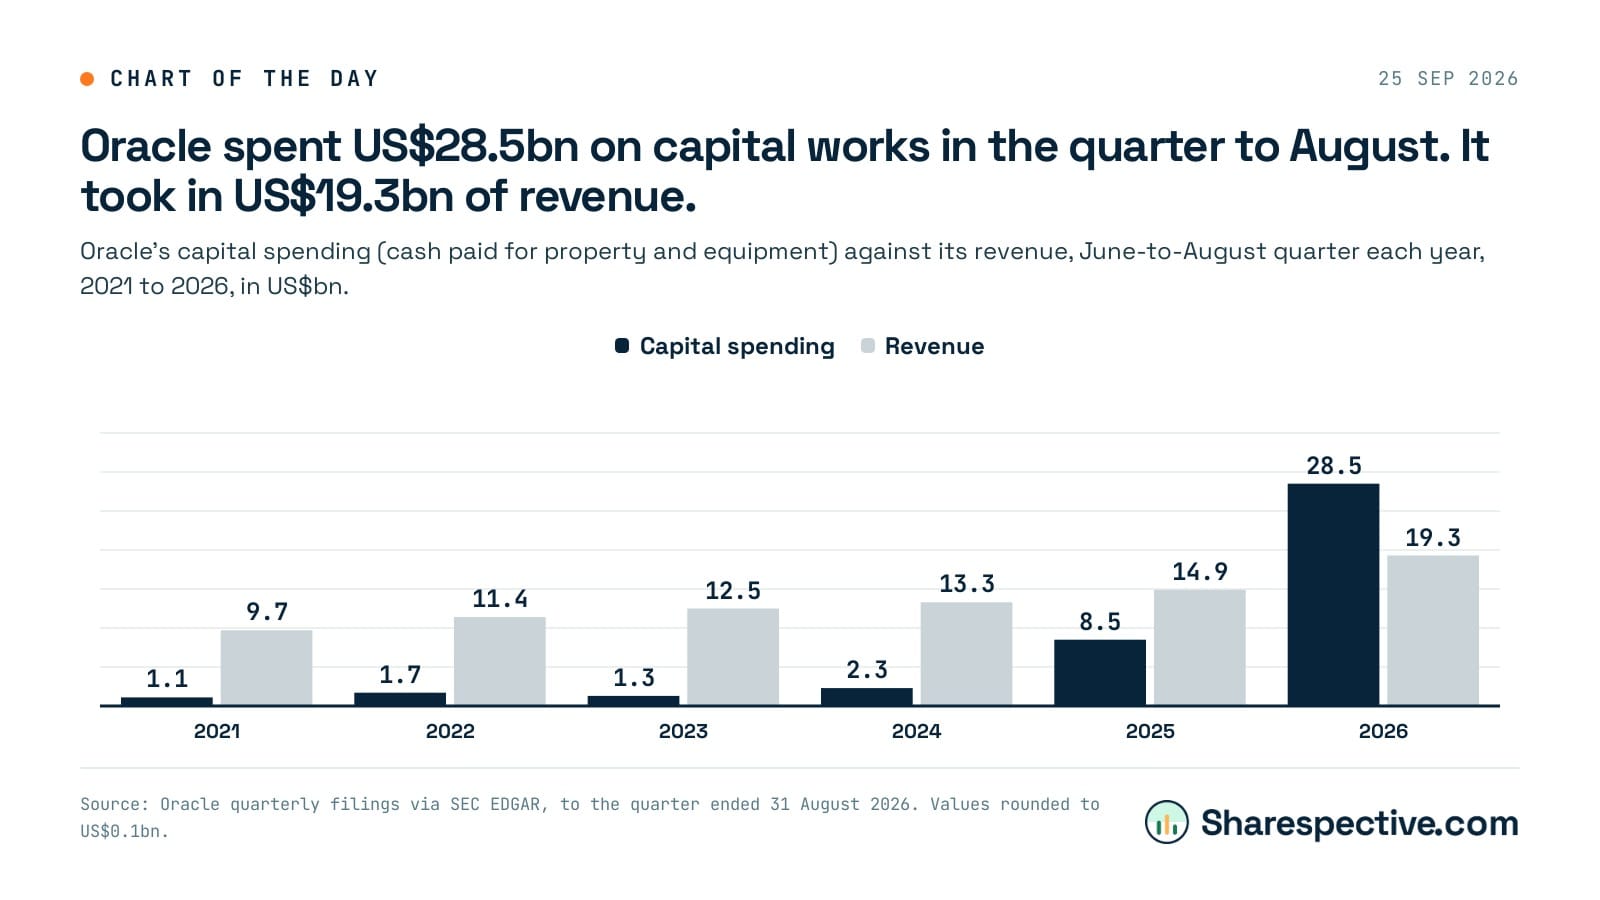 Oracle spent US$28.5bn on capital works in the quarter to August. It took in US$19.3bn of revenue
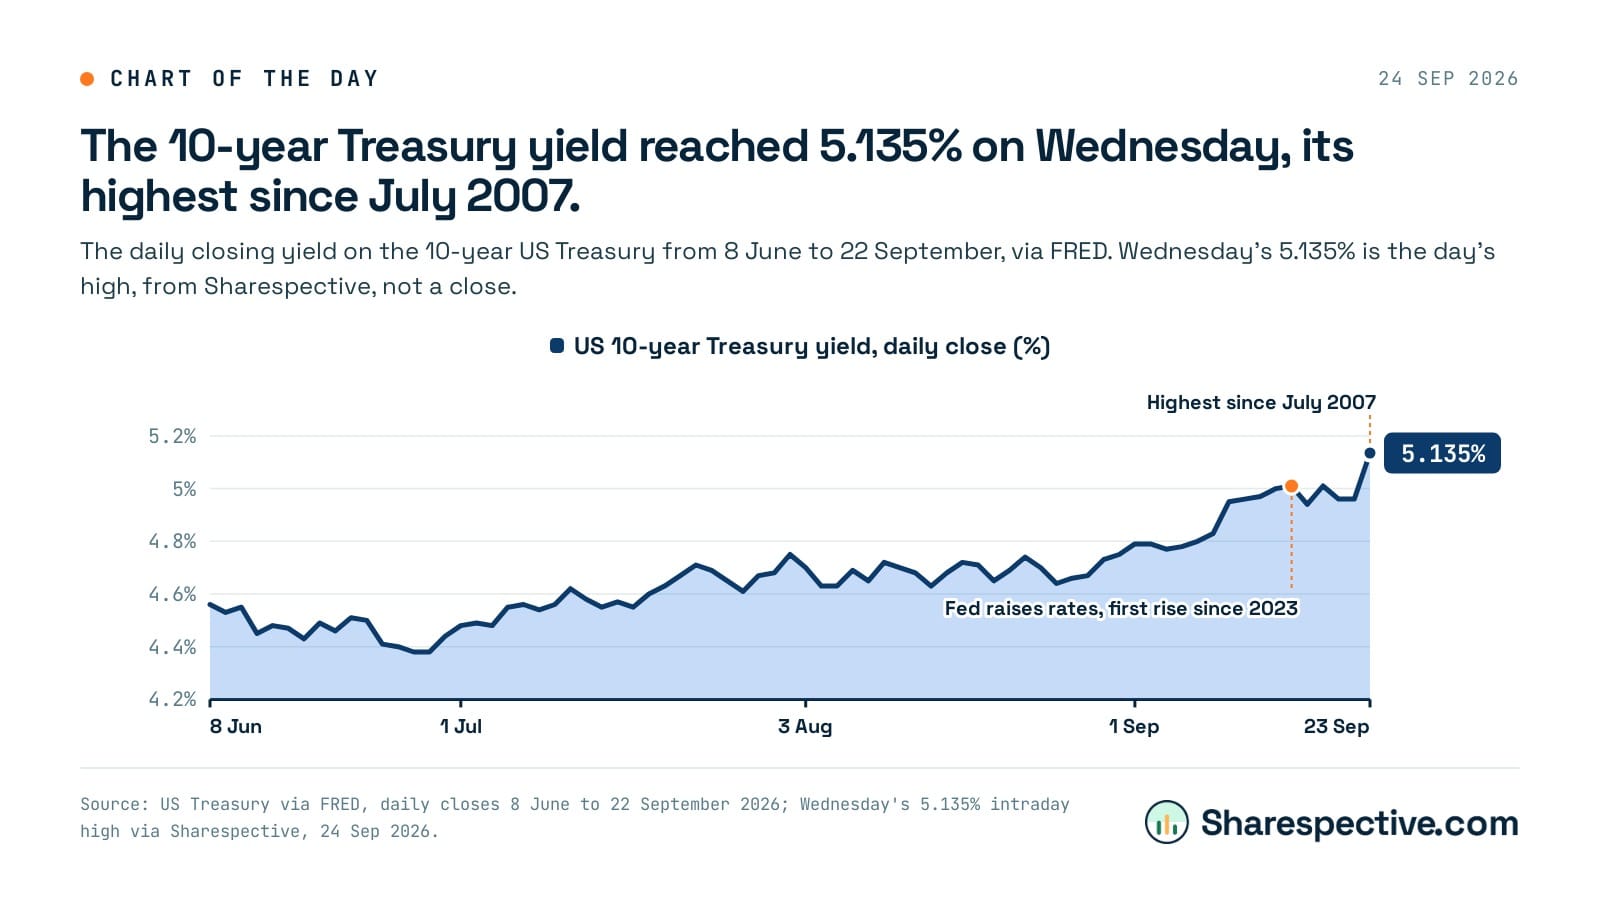 The 10-year Treasury yield reached 5.135% on Wednesday, its highest since July 2007
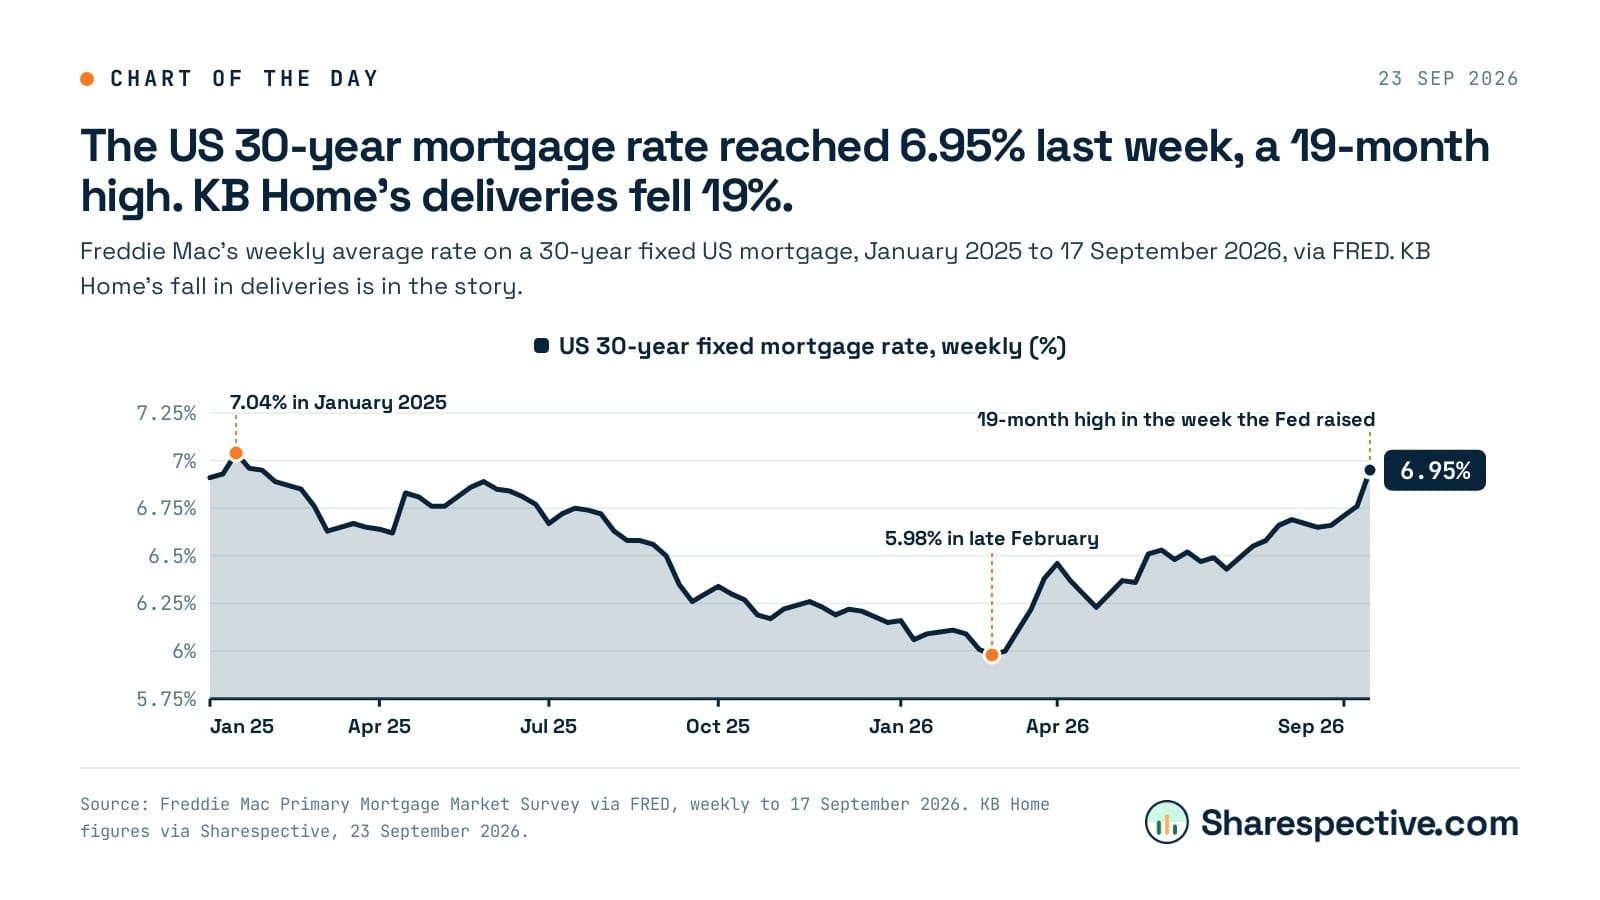 The US 30-year mortgage rate reached 6.95% last week, a 19-month high. KB Home's deliveries fell 19%
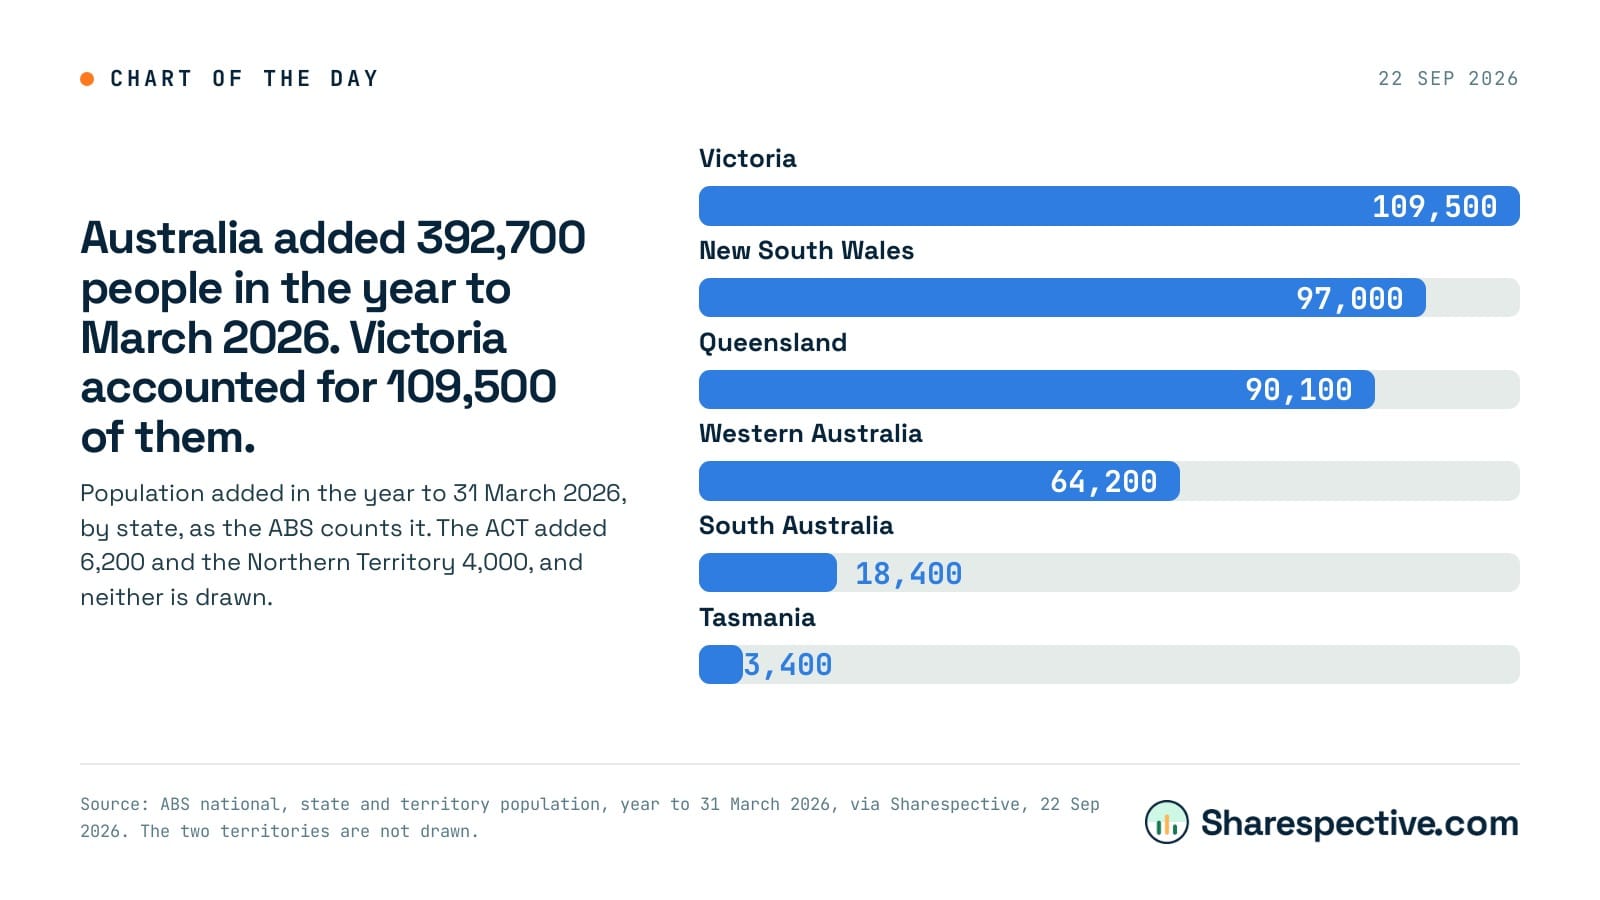 Australia added 392,700 people in the year to March 2026. Victoria accounted for 109,500 of them
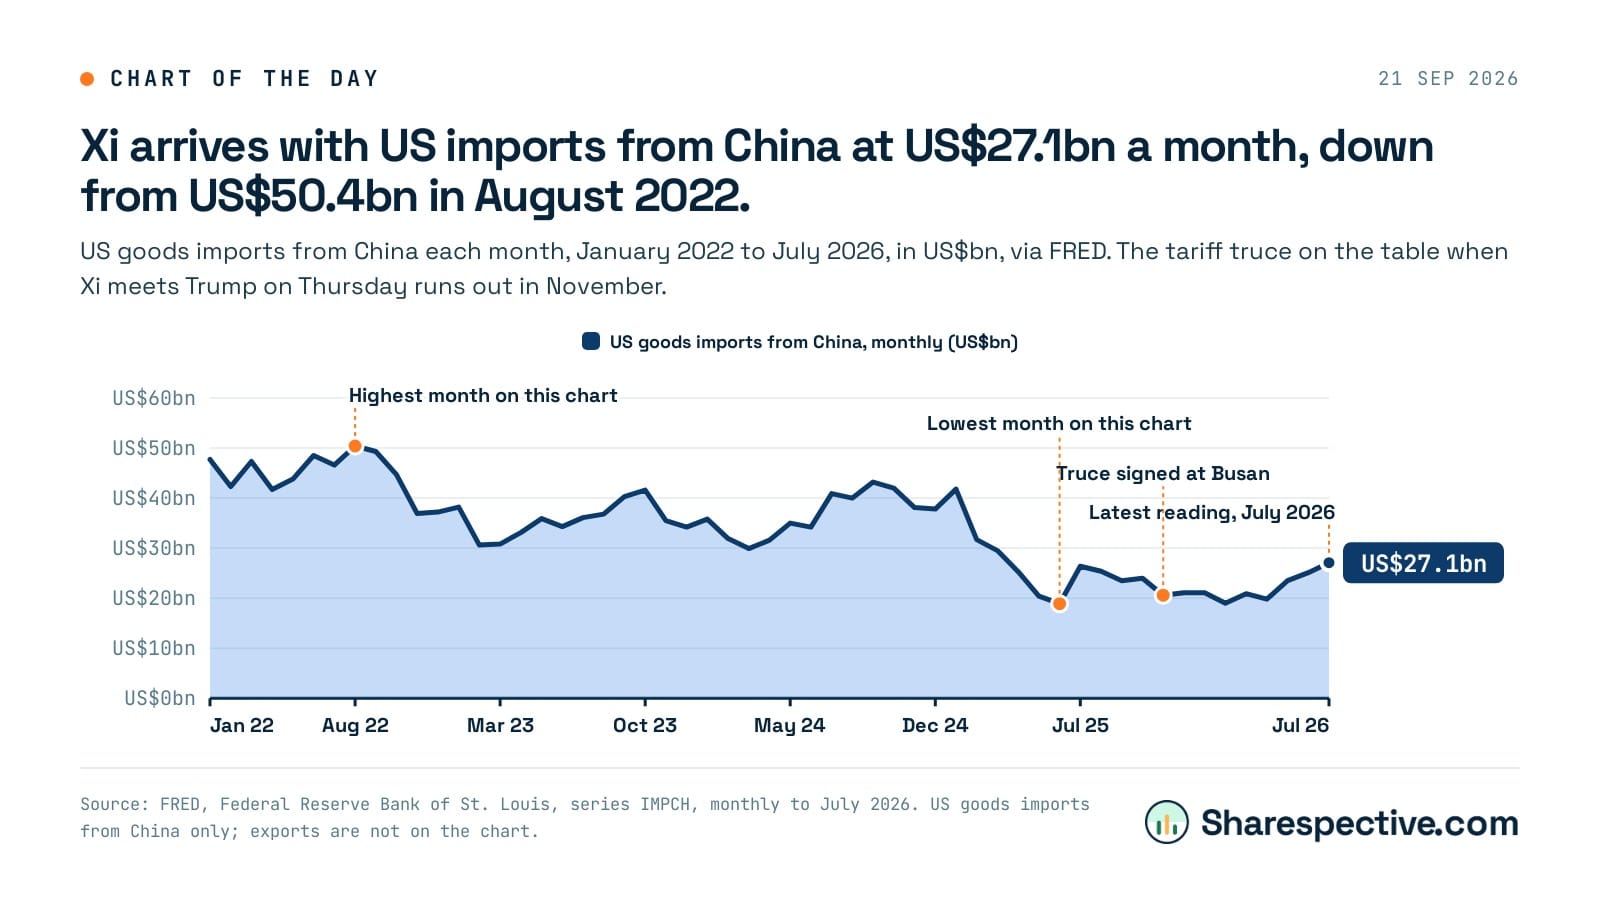 Xi arrives with US imports from China at US$27.1bn a month, down from US$50.4bn in August 2022
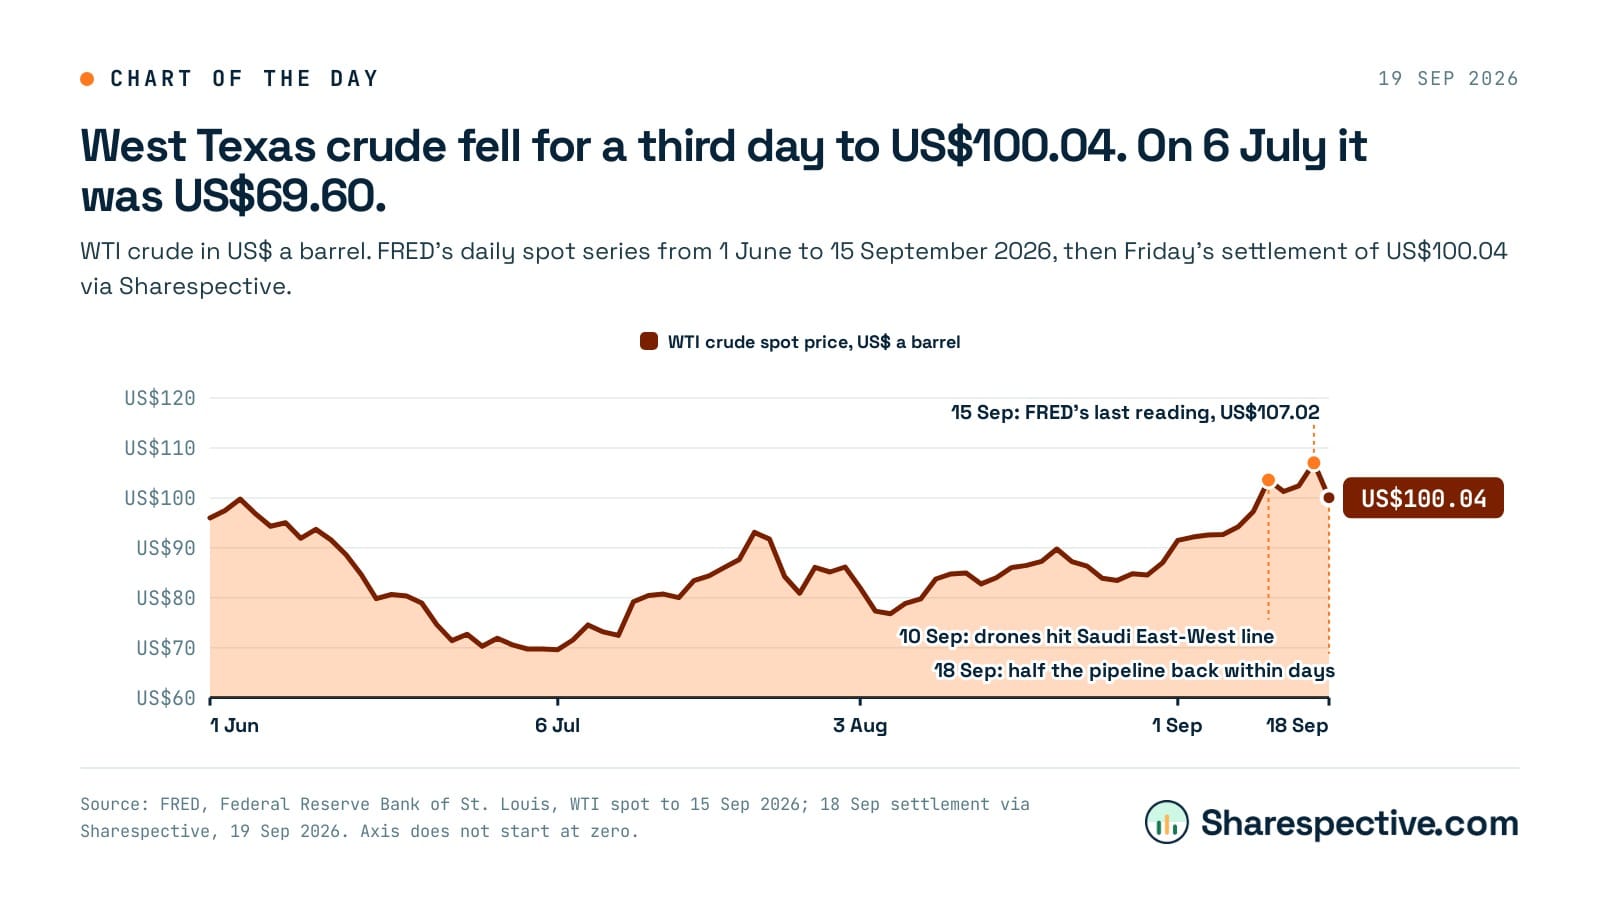 West Texas crude fell for a third day to US$100.04. On 6 July it was US$69.60
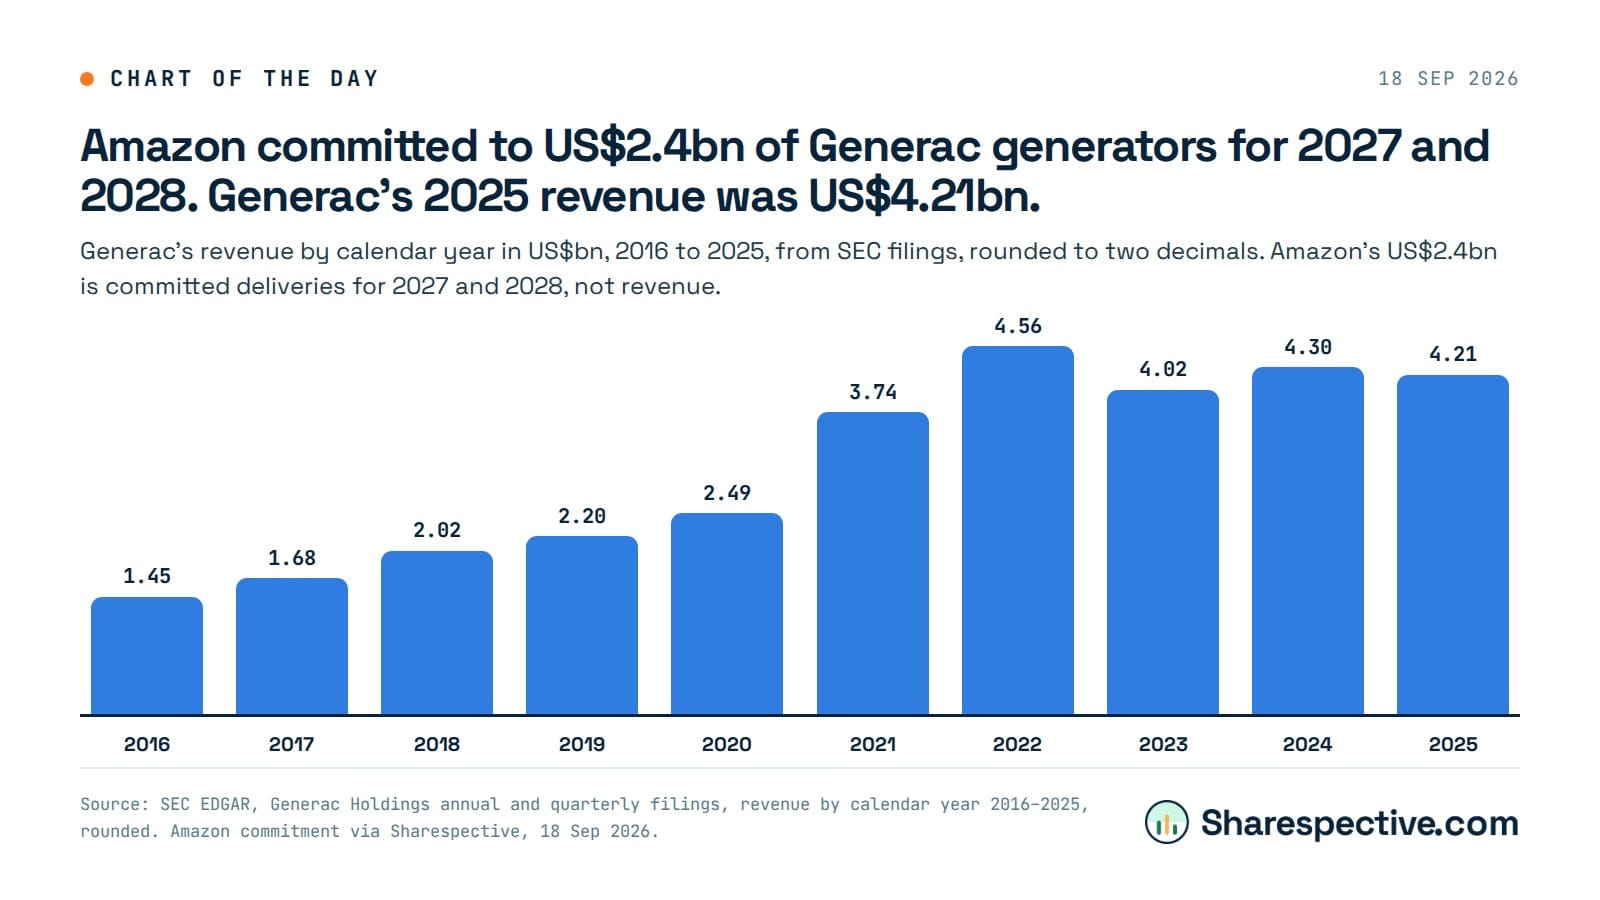 Amazon committed to US$2.4bn of Generac generators for 2027 and 2028. Generac's 2025 revenue was US$4.21bn
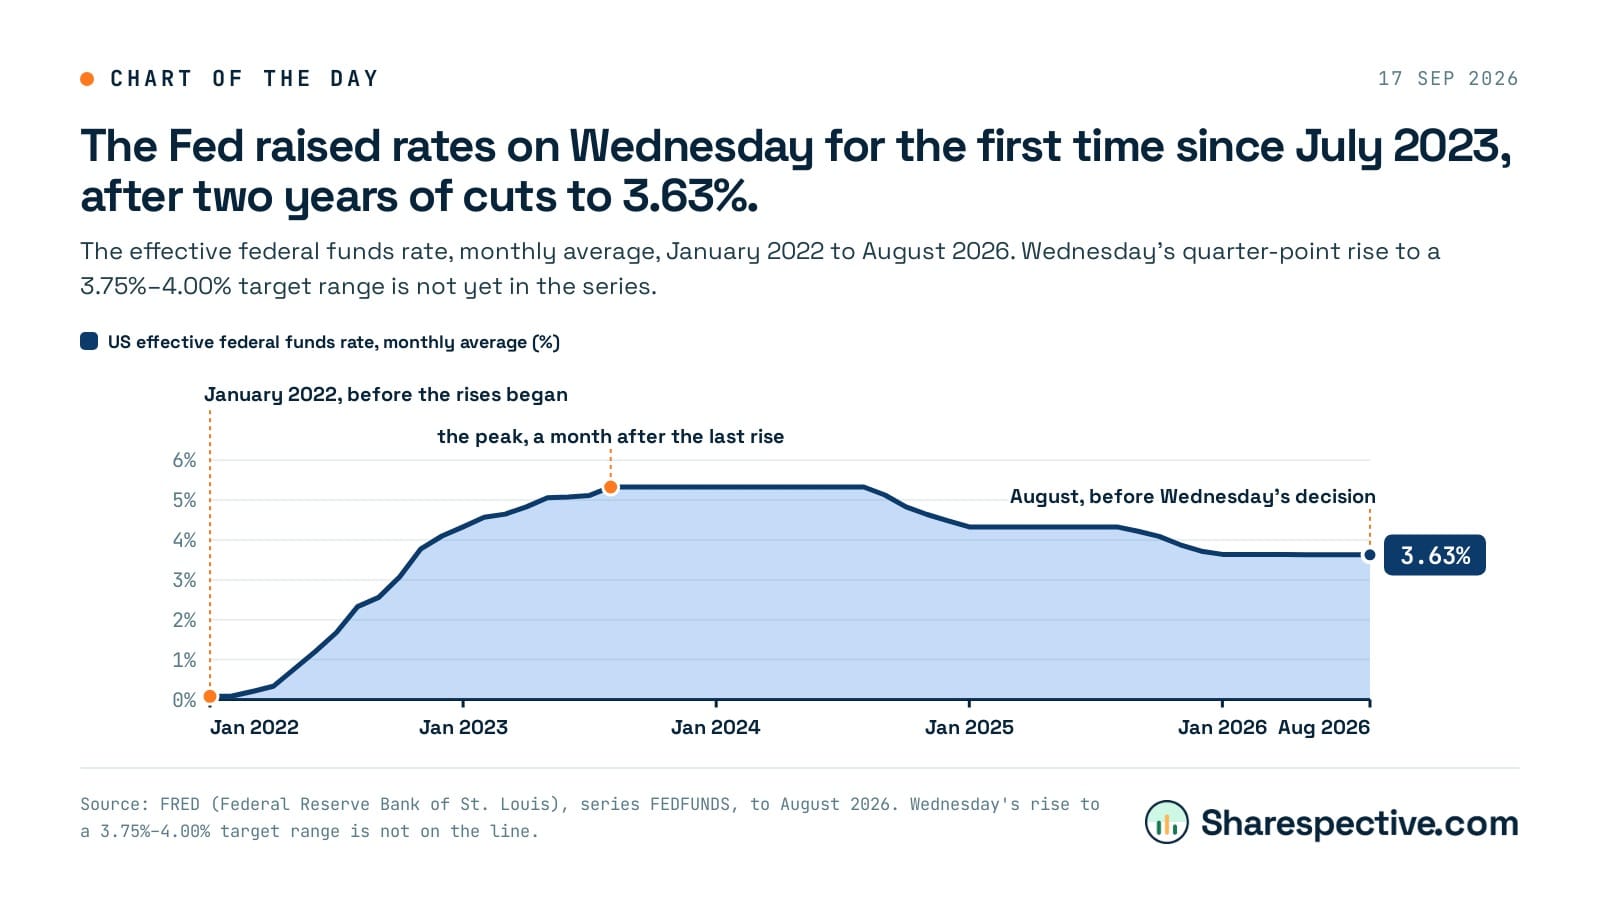 The Fed raised rates on Wednesday for the first time since July 2023, after two years of cuts to 3.63%
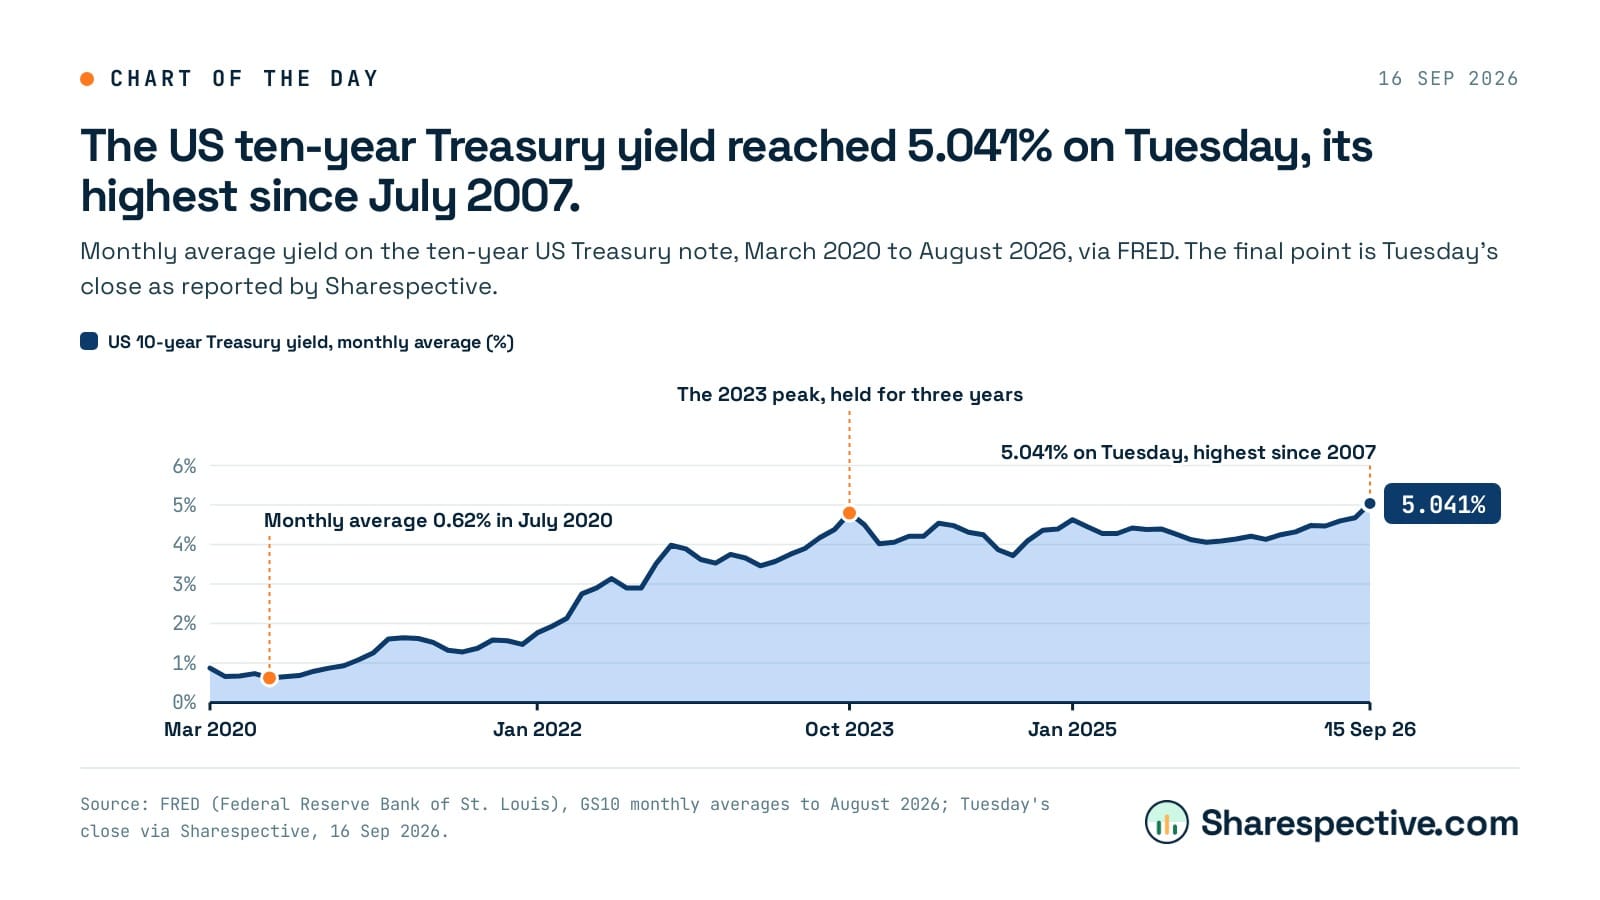 The US ten-year Treasury yield reached 5.041% on Tuesday, its highest since July 2007
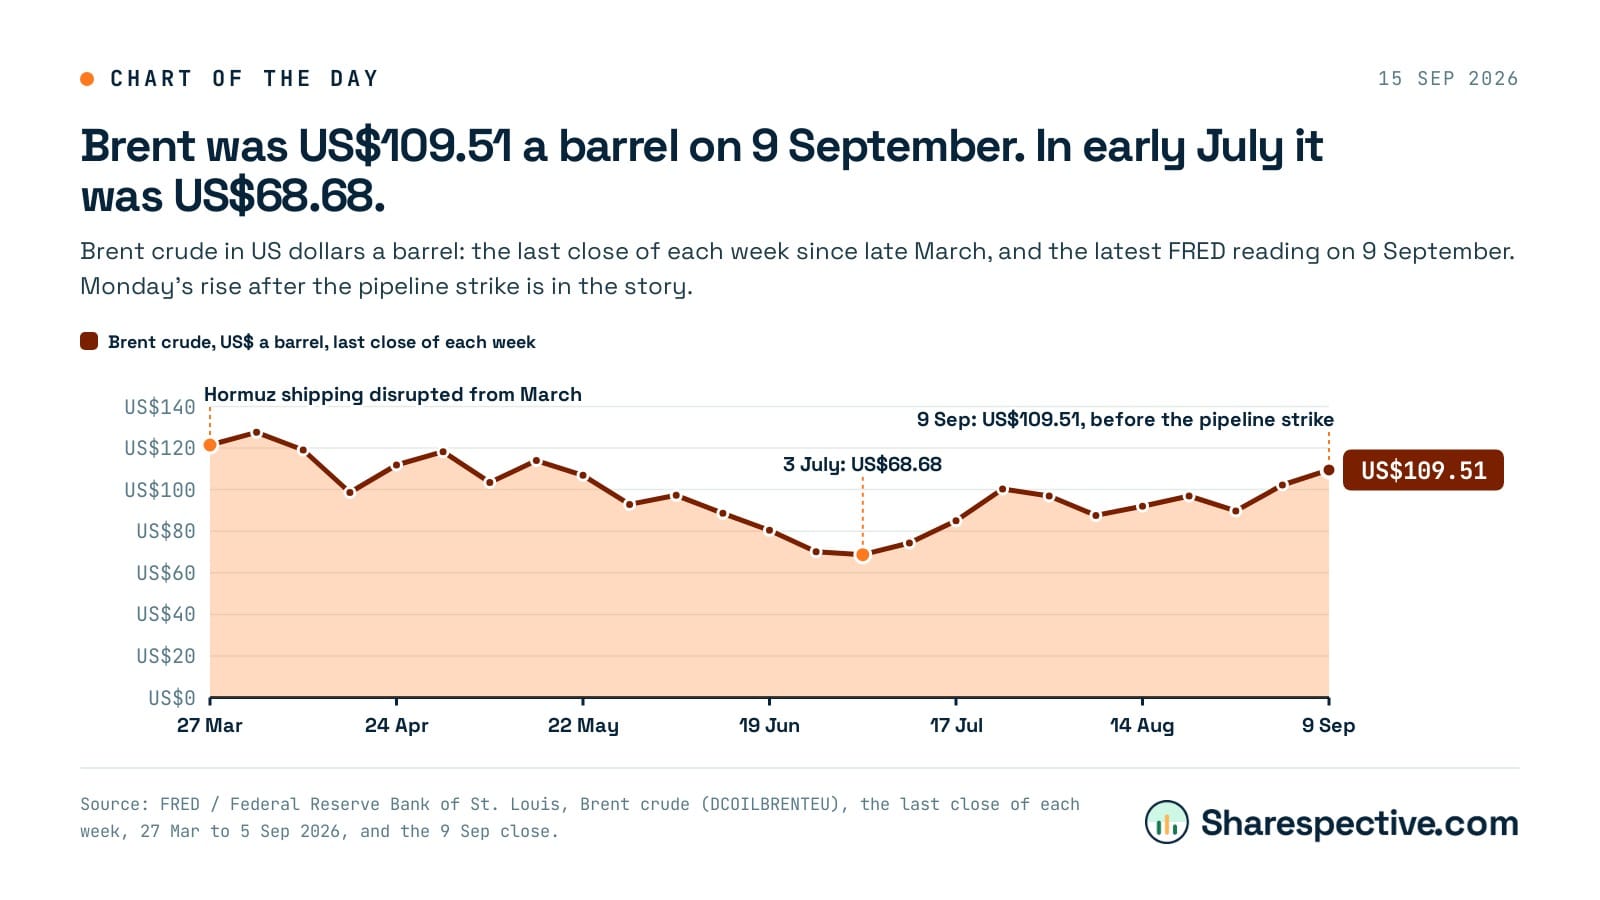 Brent was US$109.51 a barrel on 9 September. In early July it was US$68.68
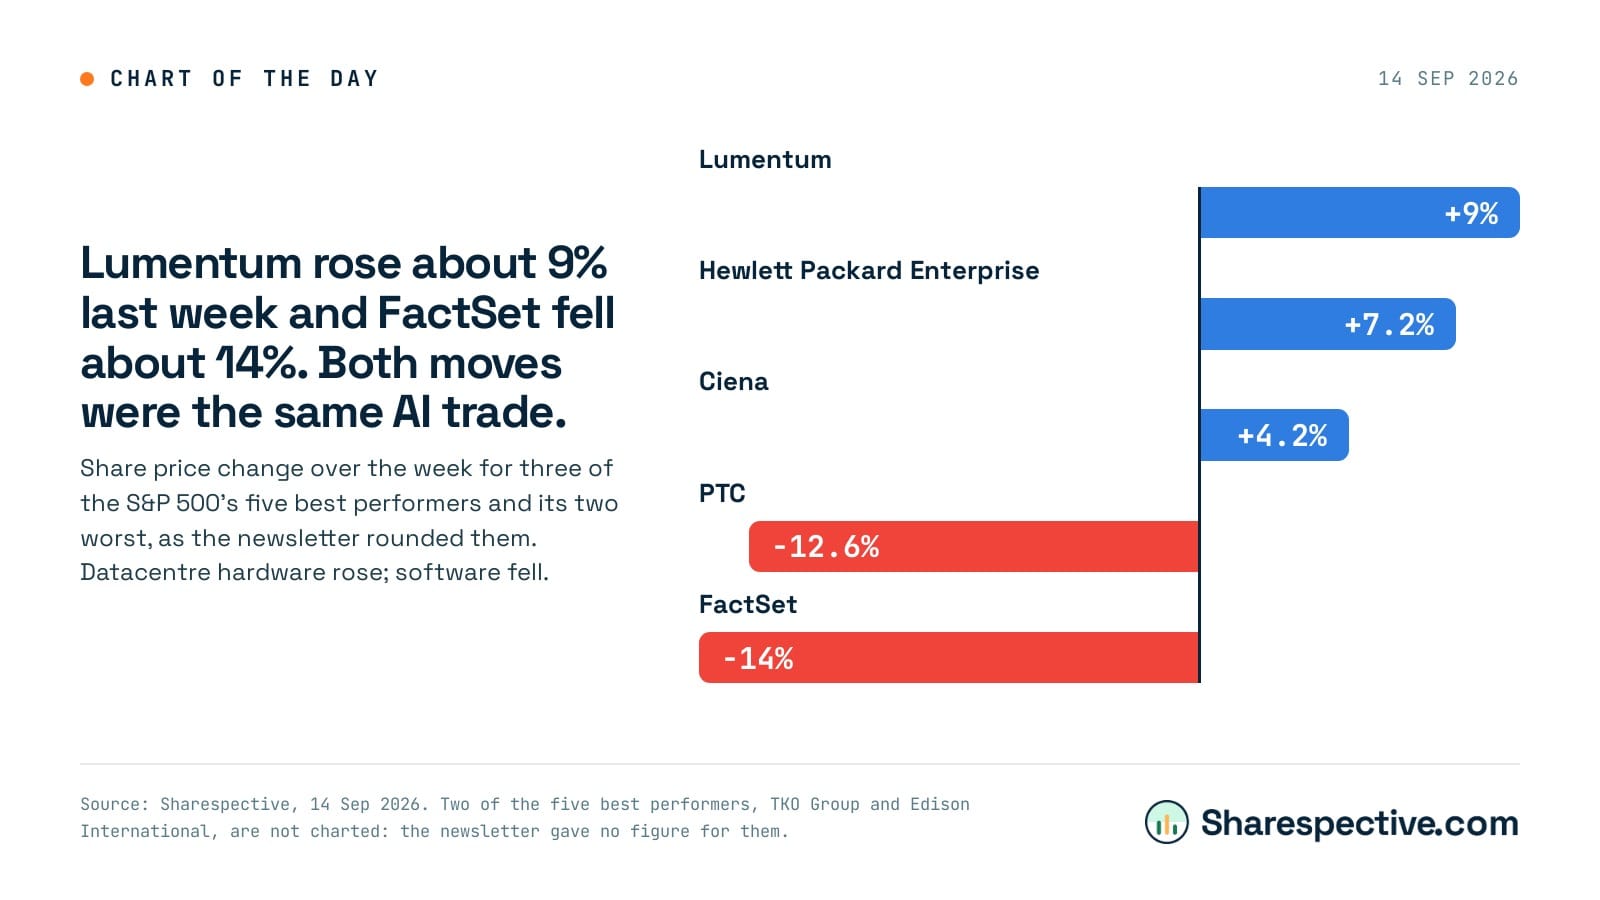 Lumentum rose about 9% last week and FactSet fell about 14%. Both moves were the same AI trade
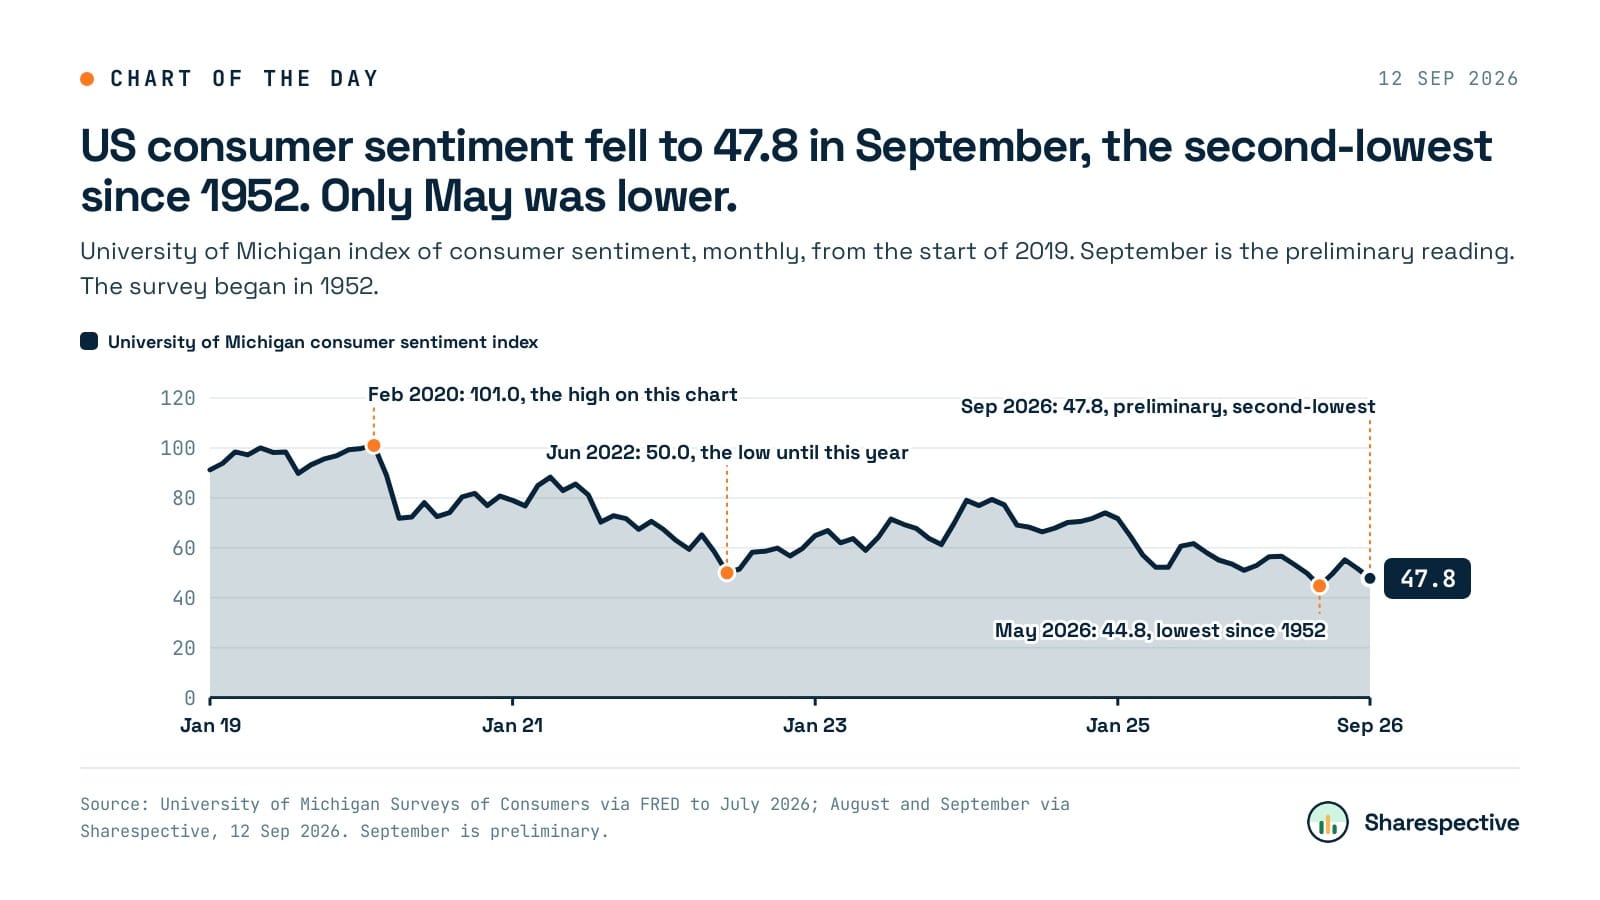 US consumer sentiment fell to 47.8 in September, the second-lowest since 1952. Only May was lower
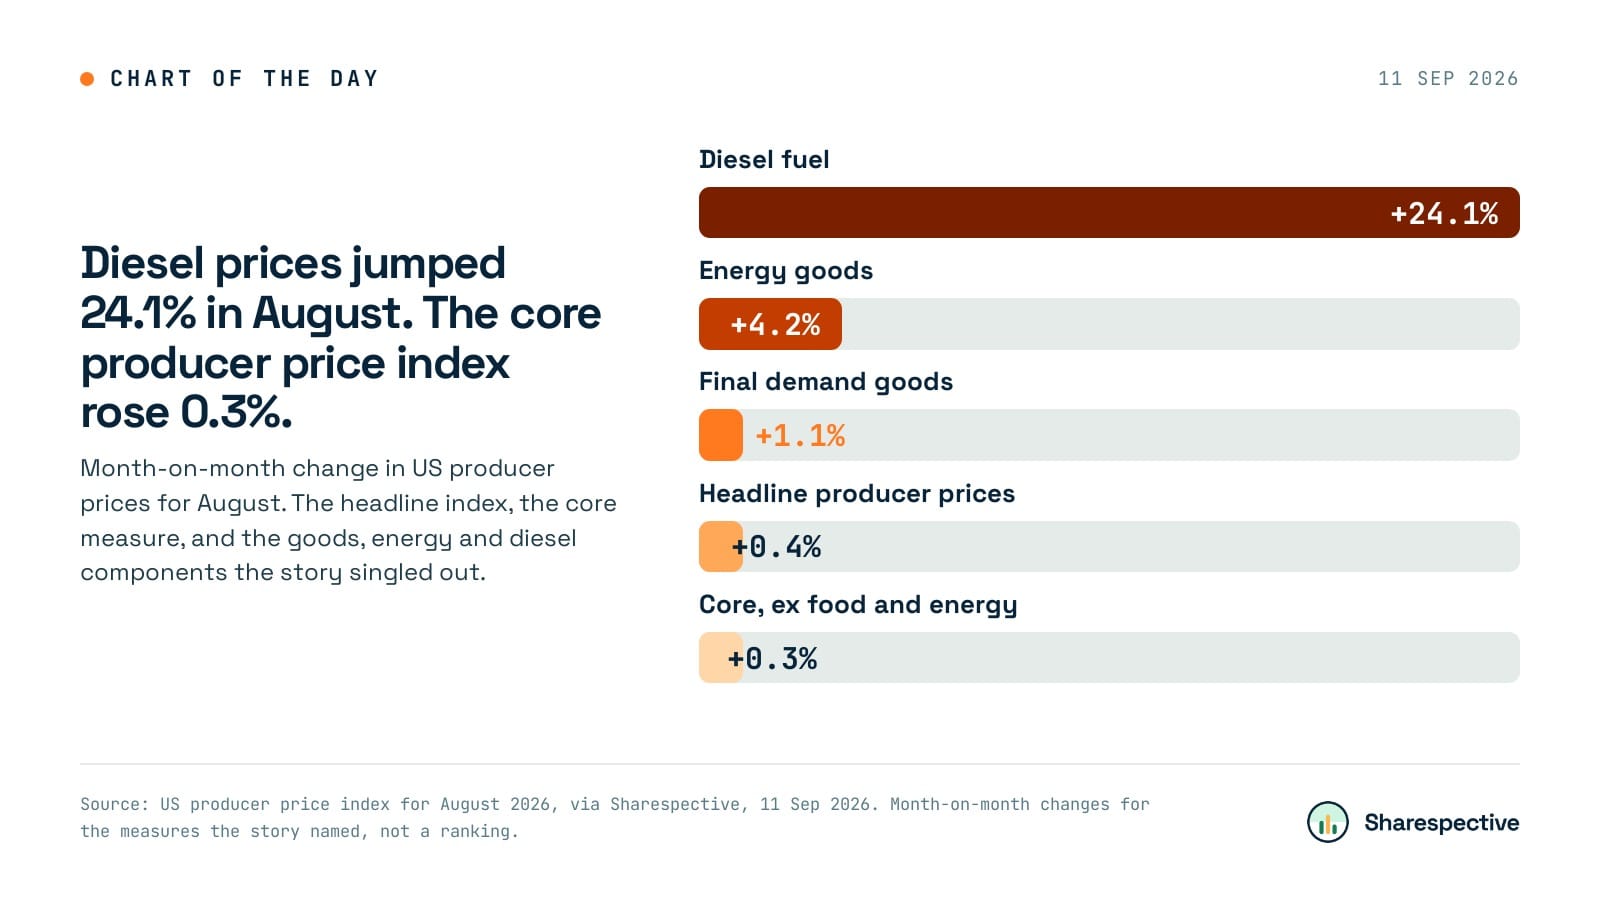 Diesel prices jumped 24.1% in August. The core producer price index rose 0.3%
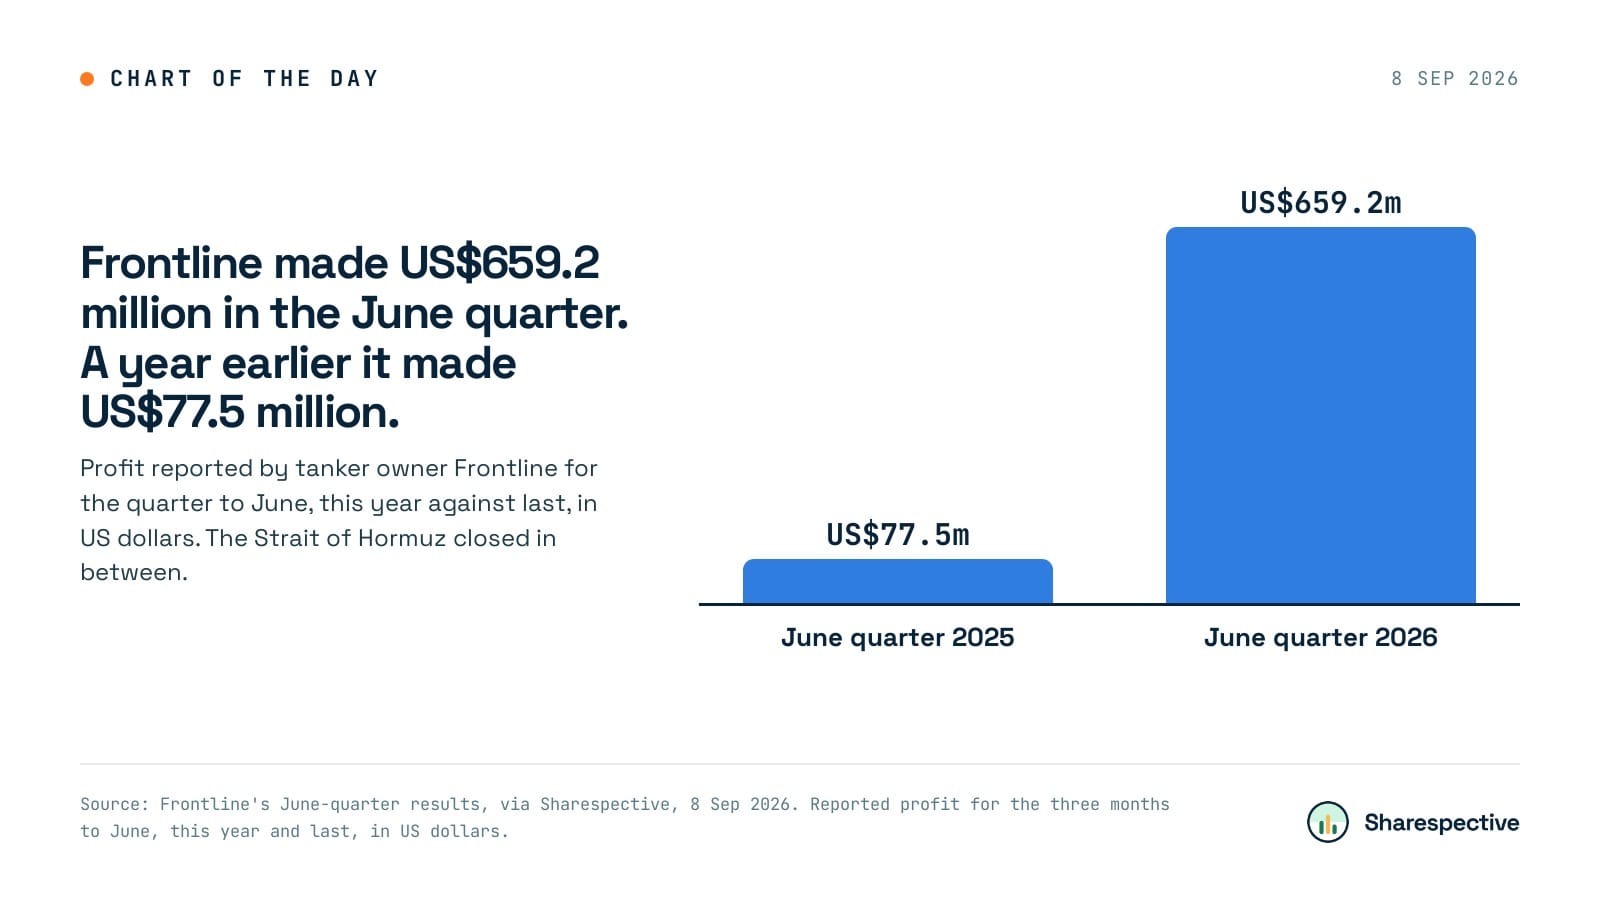 Frontline made US$659.2 million in the June quarter. A year earlier it made US$77.5 million
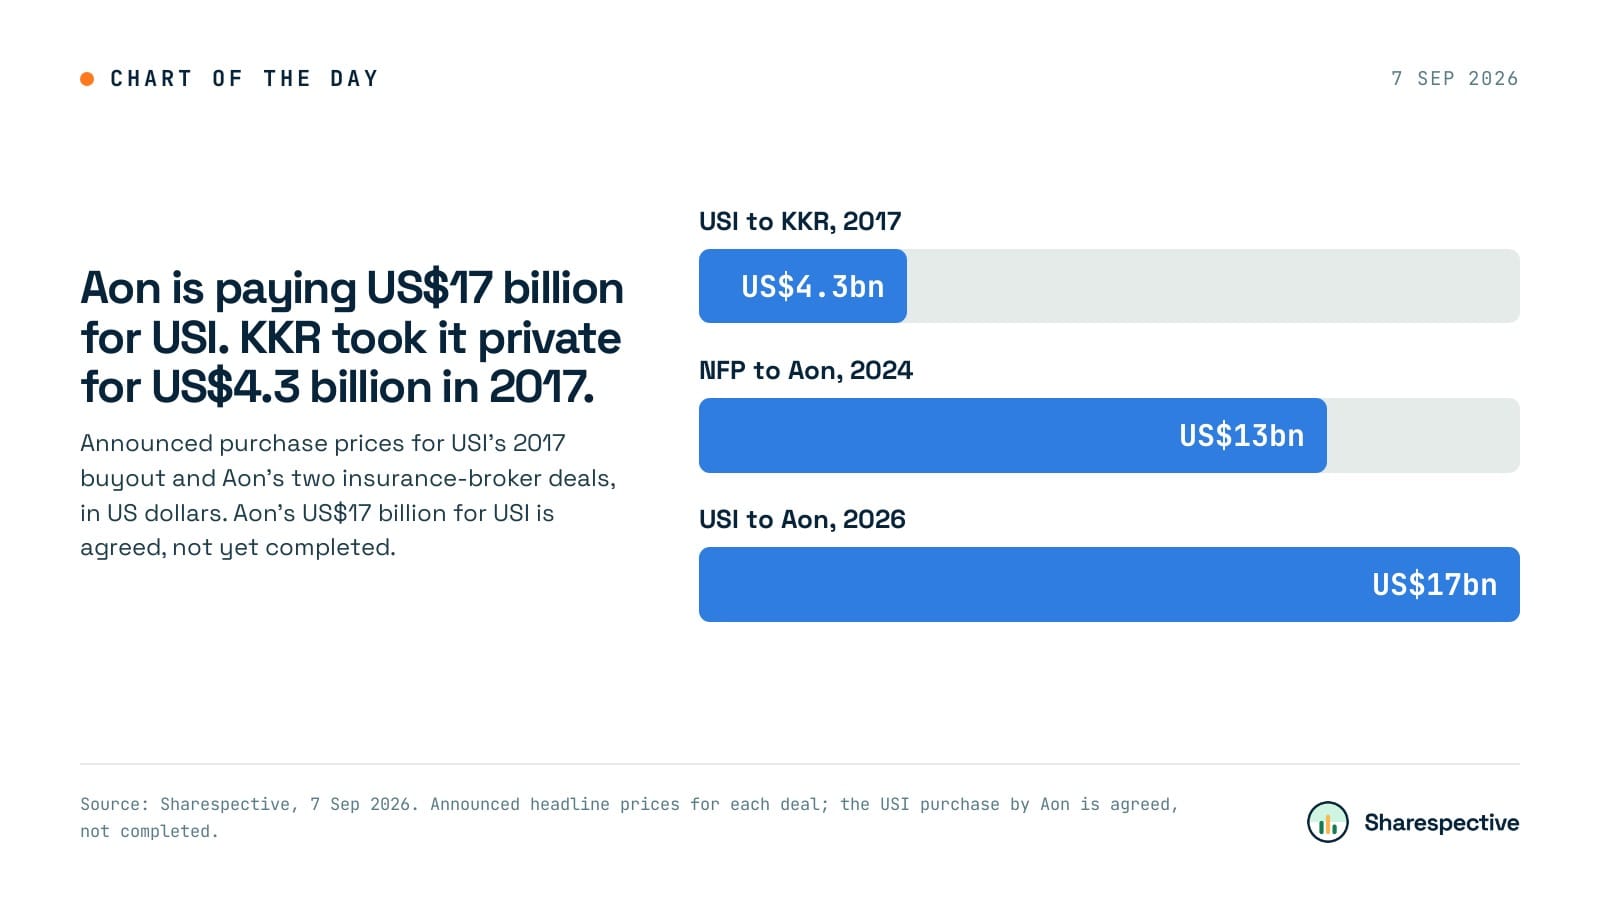 Aon is paying US$17 billion for USI. KKR took it private for US$4.3 billion in 2017
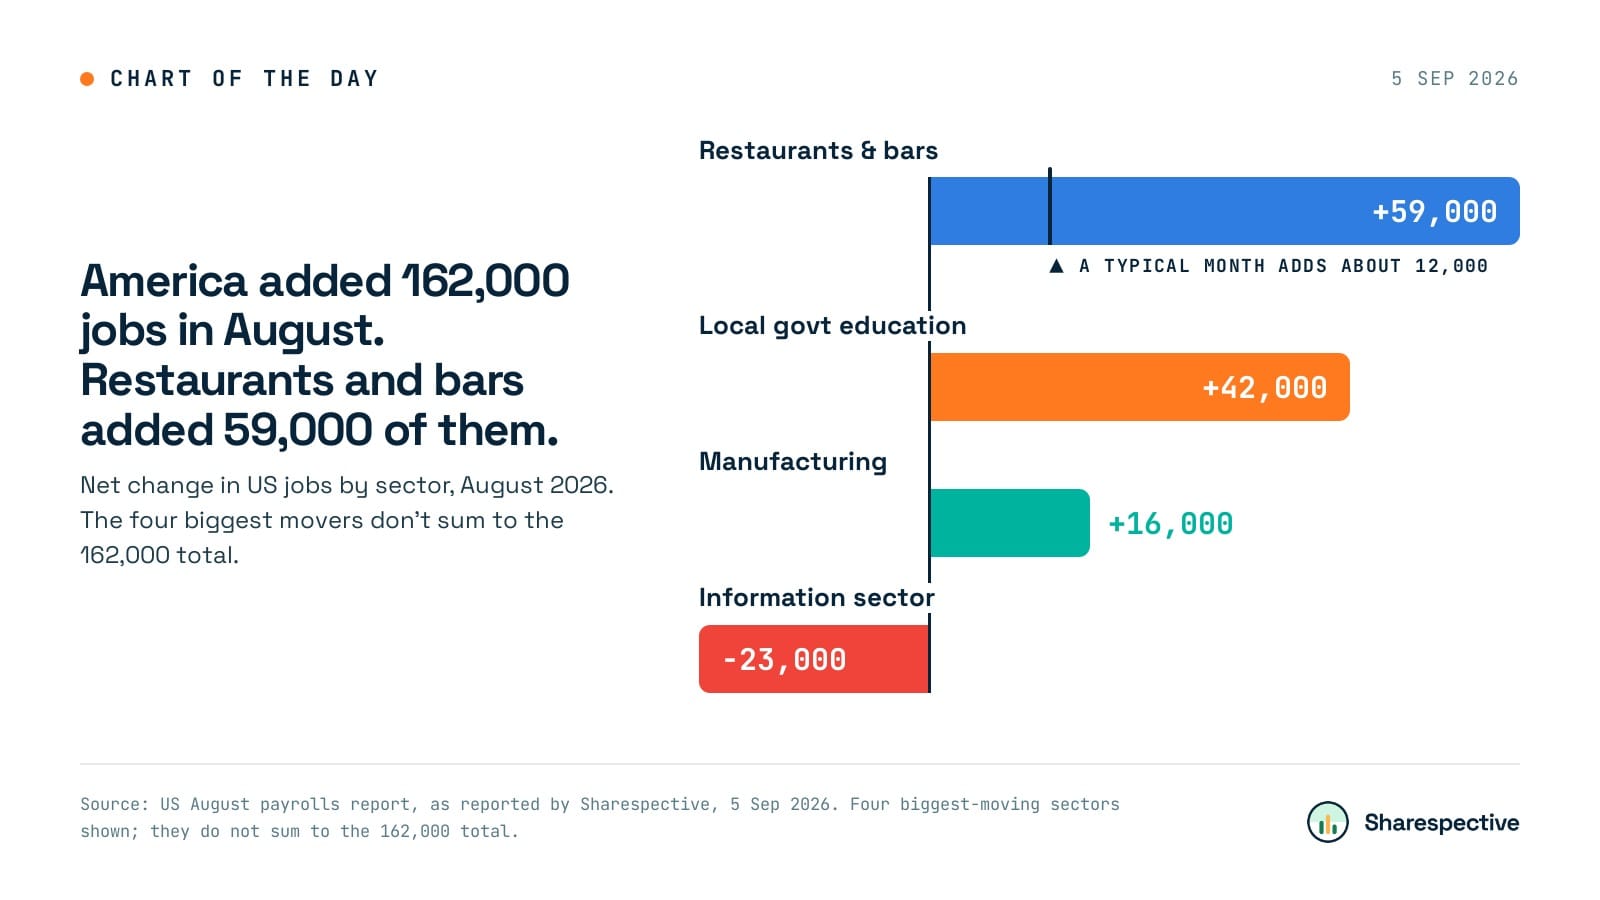 America added 162,000 jobs in August. Restaurants and bars added 59,000 of them
Not about any one morning: how markets have behaved over decades, for when a bad week feels like the end of the world.
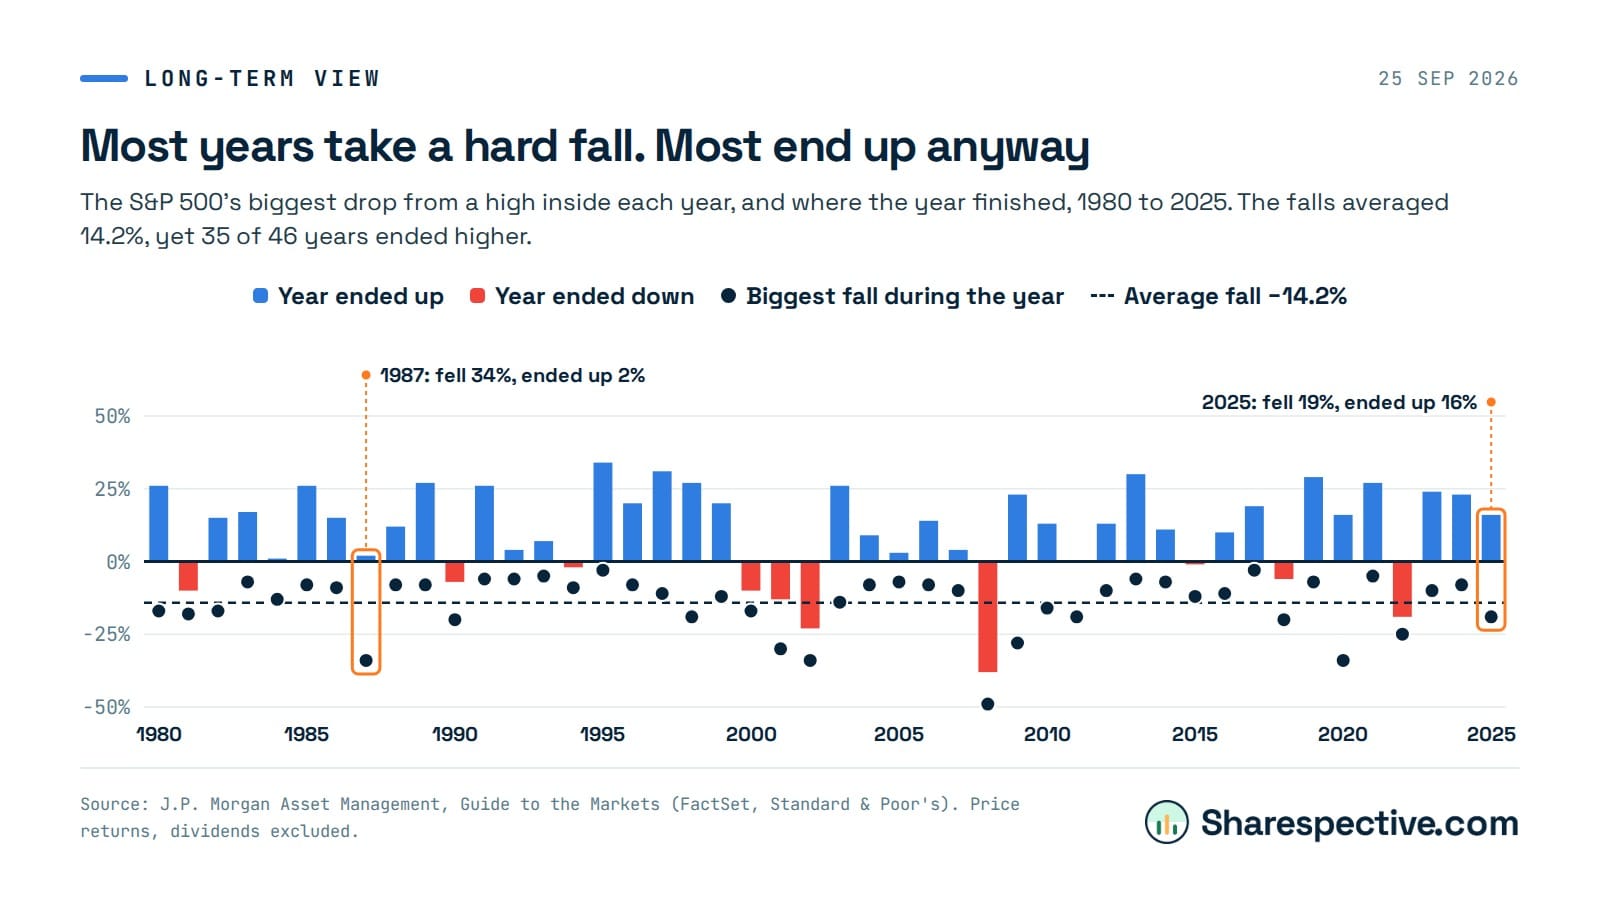 Most years take a hard fall. Most end up anyway
The S&P 500's biggest drop from a high inside each year, and where the year finished, 1980 to 2025. The falls averaged 14.2%, yet 35 of 46 years ended higher.
Most years take a hard fall. Most end up anyway
The S&P 500's biggest drop from a high inside each year, and where the year finished, 1980 to 2025. The falls averaged 14.2%, yet 35 of 46 years ended higher.
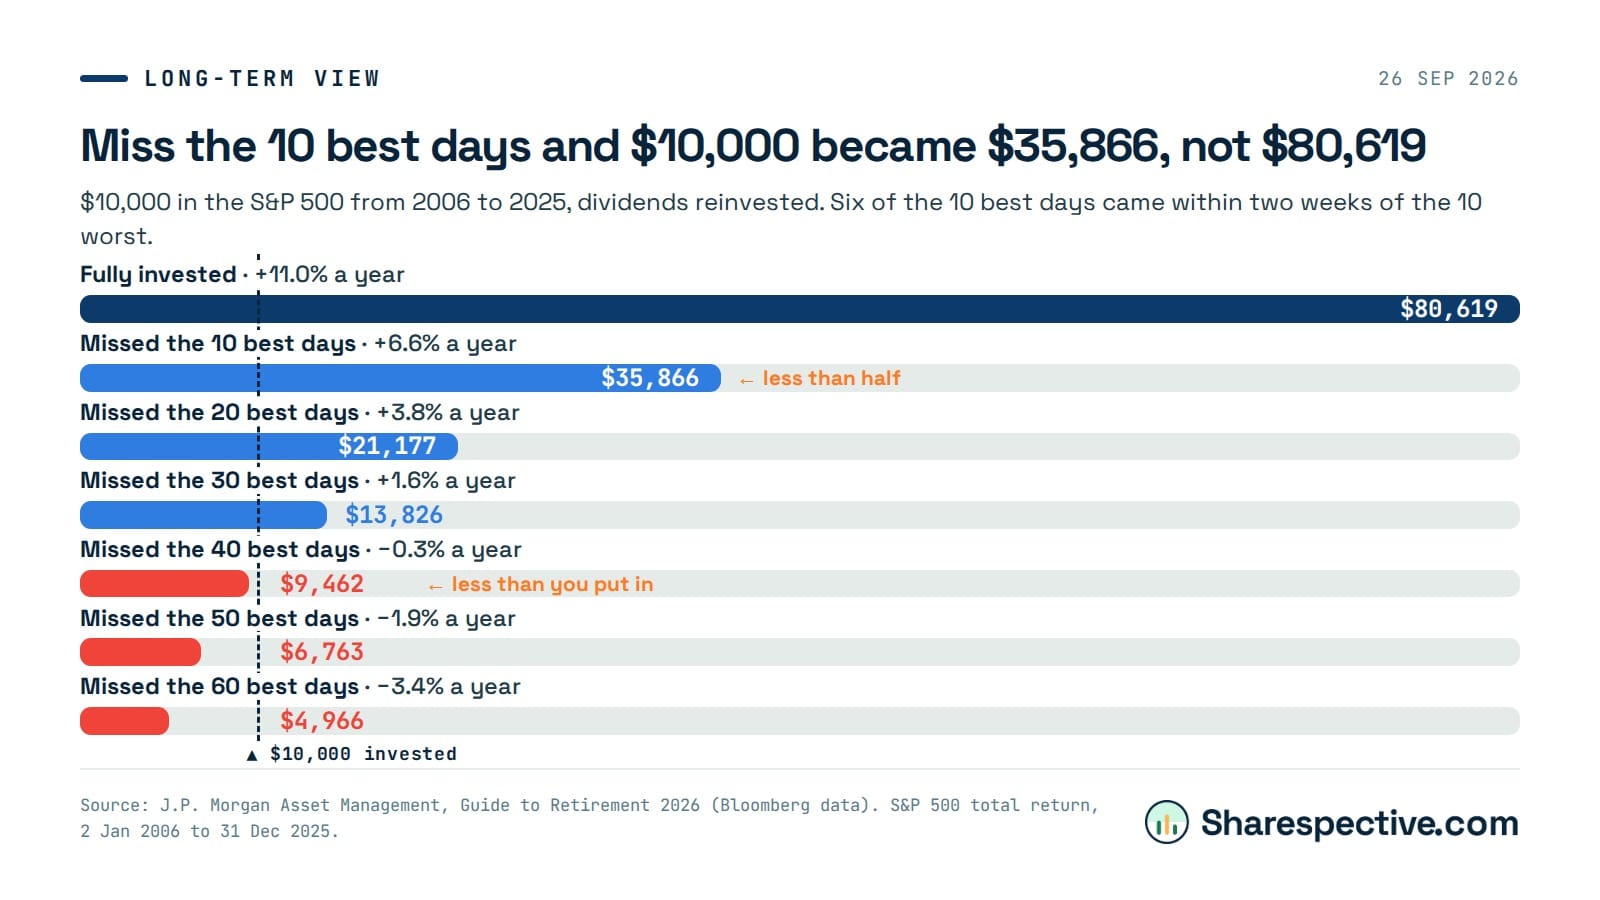 Miss the 10 best days and $10,000 became $35,866, not $80,619
$10,000 in the S&P 500 from 2006 to 2025, dividends reinvested. Six of the 10 best days came within two weeks of the 10 worst.
Miss the 10 best days and $10,000 became $35,866, not $80,619
$10,000 in the S&P 500 from 2006 to 2025, dividends reinvested. Six of the 10 best days came within two weeks of the 10 worst.
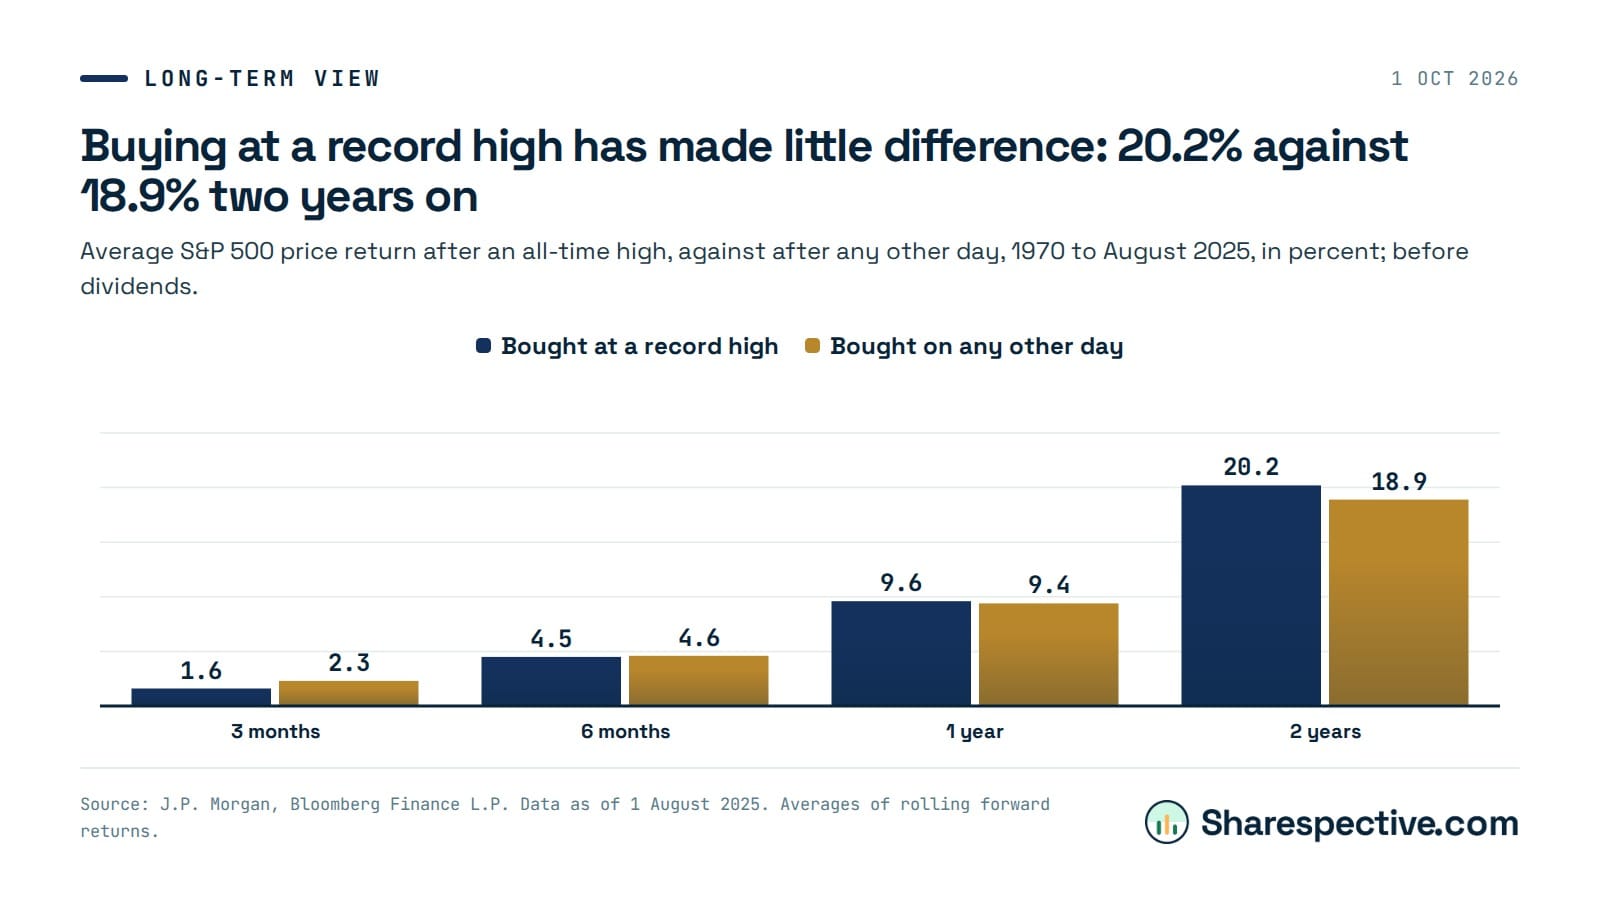 Buying at a record high has made little difference: 20.2% against 18.9% two years on
Average S&P 500 price return after an all-time high, against after any other day, 1970 to August 2025, in percent; before dividends.
Buying at a record high has made little difference: 20.2% against 18.9% two years on
Average S&P 500 price return after an all-time high, against after any other day, 1970 to August 2025, in percent; before dividends.
A new chart most mornings, shortly after the edition publishes. Each chart names its sources on the image. General information only, not financial advice. Updated 2:14pm Fri 2 Oct NZ time.