GM's September-quarter sales reach US$50.0bn
Free, six mornings a week · Unsubscribe in one click

What the chart shows
Beating forecasts was not enough for General Motors on Tuesday. Adjusted earnings rose 32% to US$3.70 a share, and the shares closed 6.84% lower at US$77.09.
The chart puts the quarter in a run back to 2010. Revenue for July to September was US$50.0bn, against US$34.1bn in 2010, and net income was US$3.3bn. What sent the shares down was costs: GM expects US$2.5bn to US$3.5bn of tariffs this year, and US$1bn to US$1.5bn of extra commodity costs in 2027.
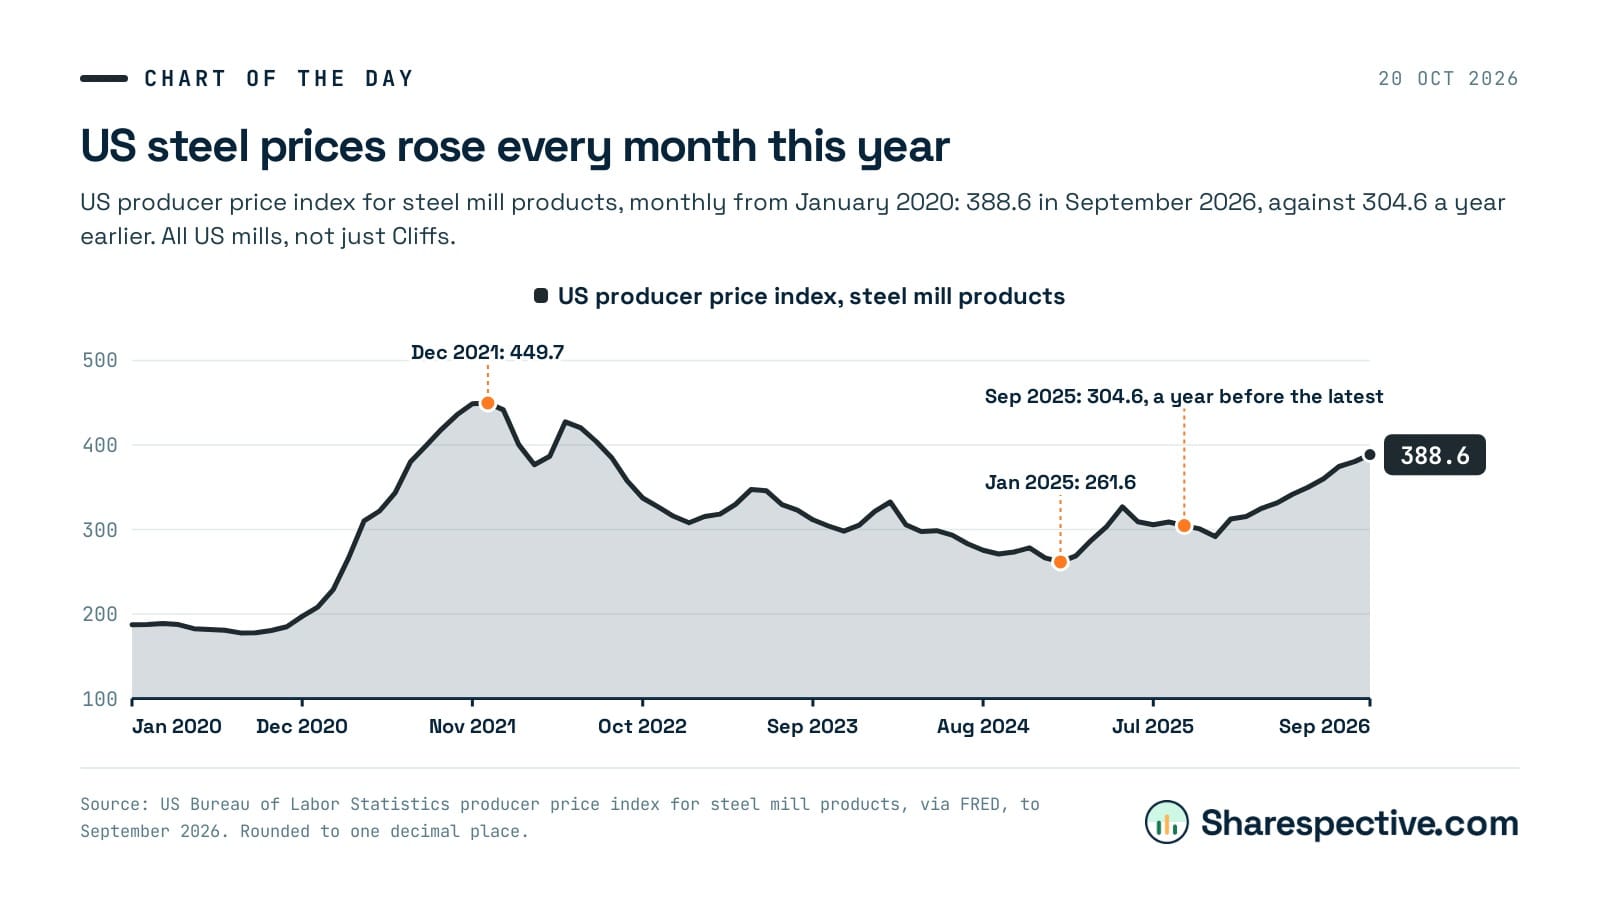
GM sets none of the prices for copper, steel or memory chips. Whether it can pass them on to buyers next year decides how comfortably the business carries its new US$20bn buyback.
The story behind it
GM beat forecasts and raised its cash outlook, and the shares still fell 6.84% Read the edition →On the calendar
The US releases that move markets, in New Zealand and Australian time. Economic calendar →The numbers
Revenue (columns) and net income (dots) in each July-to-September quarter, 2010 to 2026, in US$bn. The shares fell 6.84% on Tuesday on GM's cost outlook.
| Revenue, July-September quarter | Net income, same quarter | |
|---|---|---|
| Q3 2010 | 34.1 | 2.2 |
| Q3 2011 | 36.7 | 2.1 |
| Q3 2012 | 37.6 | 1.8 |
| Q3 2013 | 39.0 | 1.7 |
| Q3 2014 | 39.3 | 1.5 |
| Q3 2015 | 38.8 | 1.4 |
| Q3 2016 | 38.9 | 2.8 |
| Q3 2017 | 33.6 | −3.0 |
| Q3 2018 | 35.8 | 2.5 |
| Q3 2019 | 35.5 | 2.4 |
| Q3 2020 | 35.5 | 4.0 |
| Q3 2021 | 26.8 | 2.4 |
| Q3 2022 | 41.9 | 3.3 |
| Q3 2023 | 44.1 | 3.1 |
| Q3 2024 | 48.8 | 3.1 |
| Q3 2025 | 48.6 | 1.3 |
| Q3 2026 | 50.0 | 3.3 |
17 rows: scroll the table for the rest.
How we make these charts: one chart a day from a story in the edition, drawn from the figures the story names and checked against the sources named on the chart before it is published. General information only, not financial advice.