The US ten-year Treasury yield reached 5.041% on Tuesday, its highest since July 2007
A chart like this most mornings, with last night’s Wall Street · Free, six mornings a week
The story behind it
The 10-year Treasury yield hit a 19-year high the day before the Fed meets Read the edition →On the calendar
The US releases that move markets, in New Zealand and Australian time. Economic calendar →
The story behind it
The 10-year Treasury yield hit a 19-year high the day before the Fed meets Read the edition →On the calendar
The US releases that move markets, in New Zealand and Australian time. Economic calendar →What the chart shows
For three years the ceiling on the US ten-year Treasury yield was the peak it set in 2023. On Tuesday the yield went through it, closing at 5.041%, the highest since July 2007, on the eve of the Federal Reserve's meeting.
The chart plots the monthly average yield from March 2020, when it averaged 0.87%, to August 2026, with Tuesday's close added as the last point. The Fed sets the overnight rate and nothing else. Mortgages, corporate loans and long-dated company borrowing price off the ten-year, which is why the bond market has already delivered a good deal of the tightening the Fed is about to vote on.
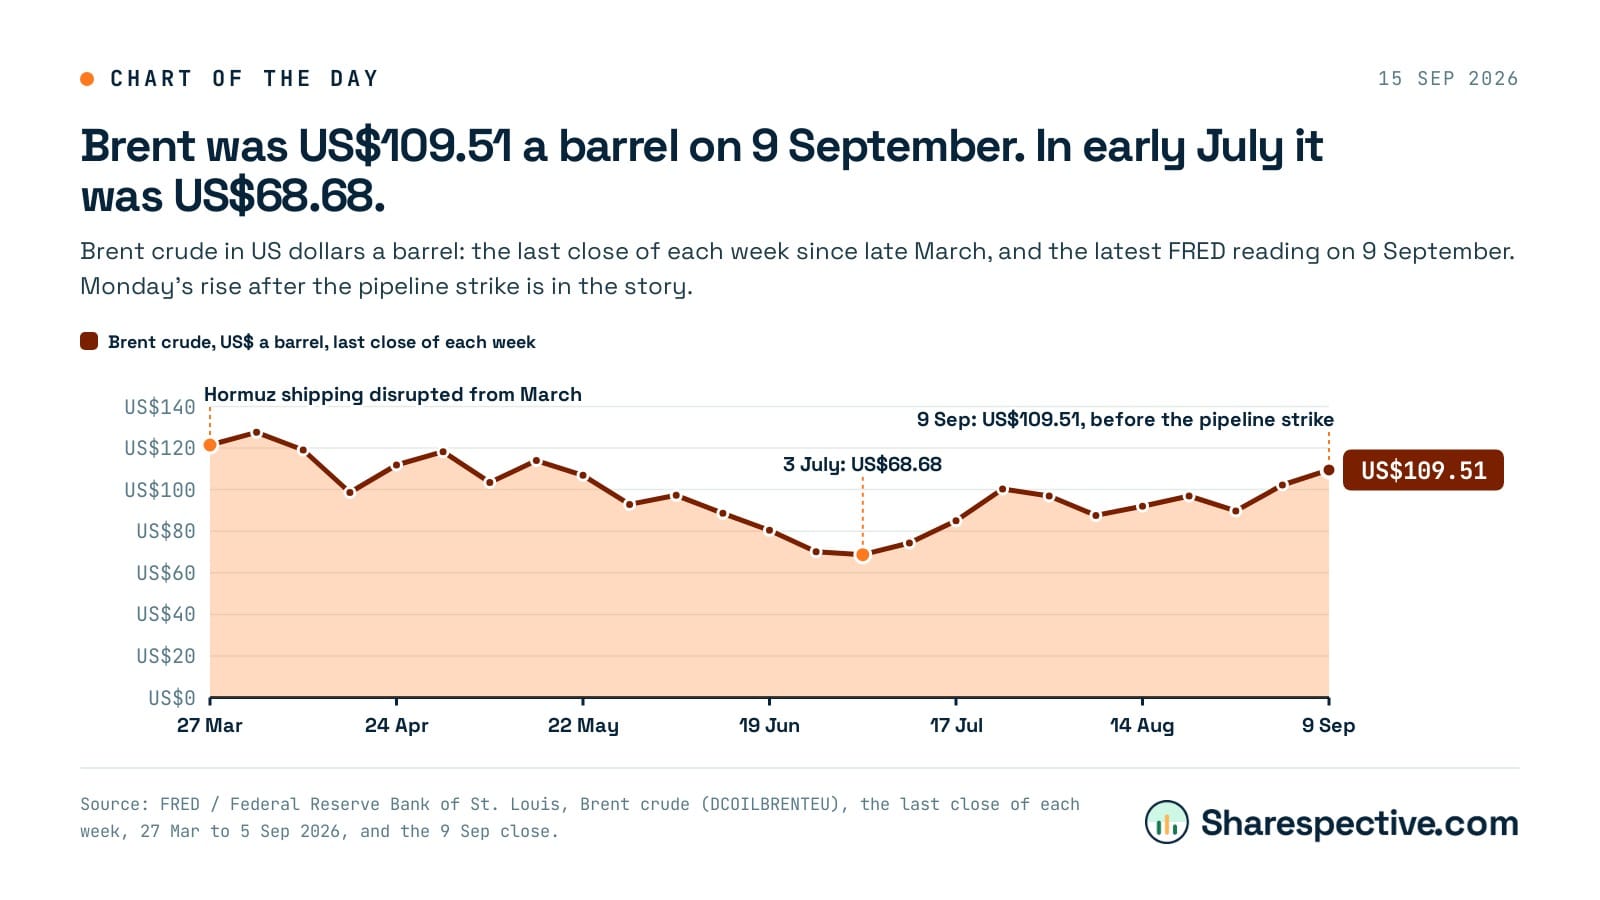
Dearer oil is the reason the long end keeps moving. Wednesday's Sharespective edition walks through why dearer crude lifts inflation expectations at every maturity at once.
The numbers
Monthly average yield on the ten-year US Treasury note, March 2020 to August 2026, via FRED. The final point is Tuesday's close as reported by Sharespective.
| US 10-year Treasury yield, monthly average (%) | |
|---|---|
| 1 Mar 2020 | 0.87% |
| 1 Apr 2020 | 0.66% |
| 1 May 2020 | 0.67% |
| 1 Jun 2020 | 0.73% |
| 1 Jul 2020 | 0.62% |
| 1 Aug 2020 | 0.65% |
| 1 Sep 2020 | 0.68% |
| 1 Oct 2020 | 0.79% |
| 1 Nov 2020 | 0.87% |
| 1 Dec 2020 | 0.93% |
| 1 Jan 2021 | 1.08% |
| 1 Feb 2021 | 1.26% |
| 1 Mar 2021 | 1.61% |
| 1 Apr 2021 | 1.64% |
| 1 May 2021 | 1.62% |
| 1 Jun 2021 | 1.52% |
| 1 Jul 2021 | 1.32% |
| 1 Aug 2021 | 1.28% |
| 1 Sep 2021 | 1.37% |
| 1 Oct 2021 | 1.58% |
| 1 Nov 2021 | 1.56% |
| 1 Dec 2021 | 1.47% |
| 1 Jan 2022 | 1.76% |
| 1 Feb 2022 | 1.93% |
| 1 Mar 2022 | 2.13% |
| 1 Apr 2022 | 2.75% |
| 1 May 2022 | 2.90% |
| 1 Jun 2022 | 3.14% |
| 1 Jul 2022 | 2.90% |
| 1 Aug 2022 | 2.90% |
| 1 Sep 2022 | 3.52% |
| 1 Oct 2022 | 3.98% |
| 1 Nov 2022 | 3.89% |
| 1 Dec 2022 | 3.62% |
| 1 Jan 2023 | 3.53% |
| 1 Feb 2023 | 3.75% |
| 1 Mar 2023 | 3.66% |
| 1 Apr 2023 | 3.46% |
| 1 May 2023 | 3.57% |
| 1 Jun 2023 | 3.75% |
| 1 Jul 2023 | 3.90% |
| 1 Aug 2023 | 4.17% |
| 1 Sep 2023 | 4.38% |
| 1 Oct 2023 | 4.80% |
| 1 Nov 2023 | 4.50% |
| 1 Dec 2023 | 4.02% |
| 1 Jan 2024 | 4.06% |
| 1 Feb 2024 | 4.21% |
| 1 Mar 2024 | 4.21% |
| 1 Apr 2024 | 4.54% |
| 1 May 2024 | 4.48% |
| 1 Jun 2024 | 4.31% |
| 1 Jul 2024 | 4.25% |
| 1 Aug 2024 | 3.87% |
| 1 Sep 2024 | 3.72% |
| 1 Oct 2024 | 4.10% |
| 1 Nov 2024 | 4.36% |
| 1 Dec 2024 | 4.39% |
| 1 Jan 2025 | 4.63% |
| 1 Feb 2025 | 4.45% |
| 1 Mar 2025 | 4.28% |
| 1 Apr 2025 | 4.28% |
| 1 May 2025 | 4.42% |
| 1 Jun 2025 | 4.38% |
| 1 Jul 2025 | 4.39% |
| 1 Aug 2025 | 4.26% |
| 1 Sep 2025 | 4.12% |
| 1 Oct 2025 | 4.06% |
| 1 Nov 2025 | 4.09% |
| 1 Dec 2025 | 4.14% |
| 1 Jan 2026 | 4.21% |
| 1 Feb 2026 | 4.13% |
| 1 Mar 2026 | 4.25% |
| 1 Apr 2026 | 4.32% |
| 1 May 2026 | 4.48% |
| 1 Jun 2026 | 4.47% |
| 1 Jul 2026 | 4.60% |
| 1 Aug 2026 | 4.68% |
| 16 Sep 2026 | 5.041% |
79 rows: scroll the table for the rest.
How we make these charts: one chart a day from a story in the edition, drawn from the figures the story names and checked against the sources named on the chart before it is published. General information only, not financial advice.