Miss the 10 best days and $10,000 became $35,866, not $80,619
A chart like this most mornings, with last night’s Wall Street · Free, six mornings a week
On the calendar
The US releases that move markets, in New Zealand and Australian time. Economic calendar →
On the calendar
The US releases that move markets, in New Zealand and Australian time. Economic calendar →What the chart shows
What does it cost to miss the stock market's best days? J.P. Morgan ran the numbers on $10,000 in the S&P 500 from 2006 to 2025, dividends reinvested.
Fully invested, it grew to $80,619, 11.0% a year. Miss the 10 best days and it came to $35,866. Miss 30 and it was $13,826. Miss 40 and you finished with $9,462, less than you put in.
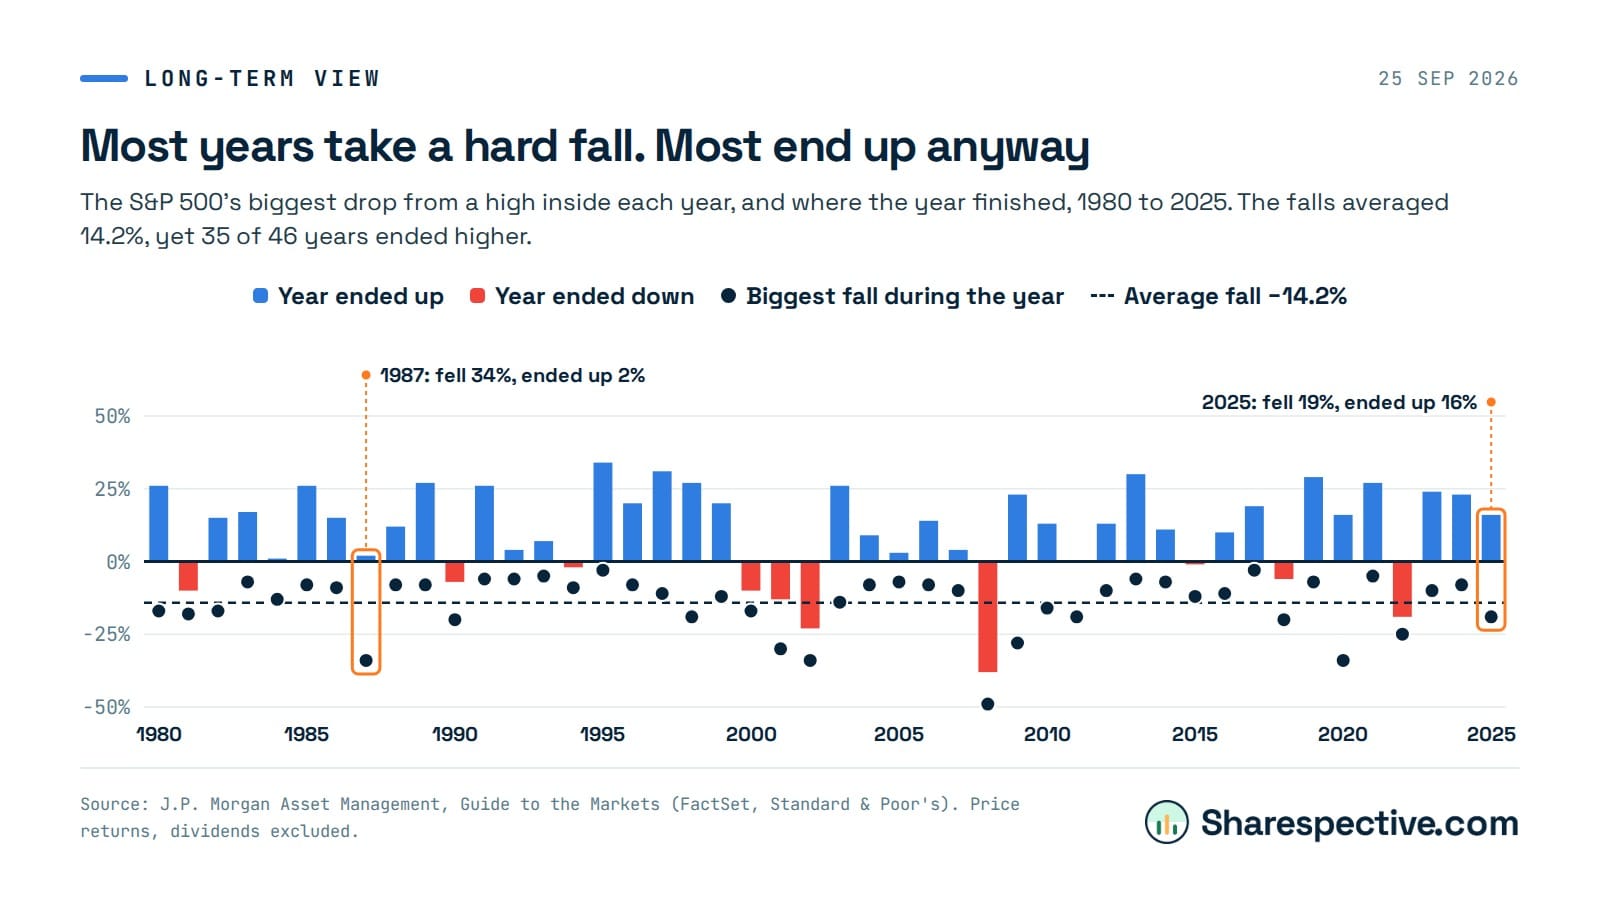
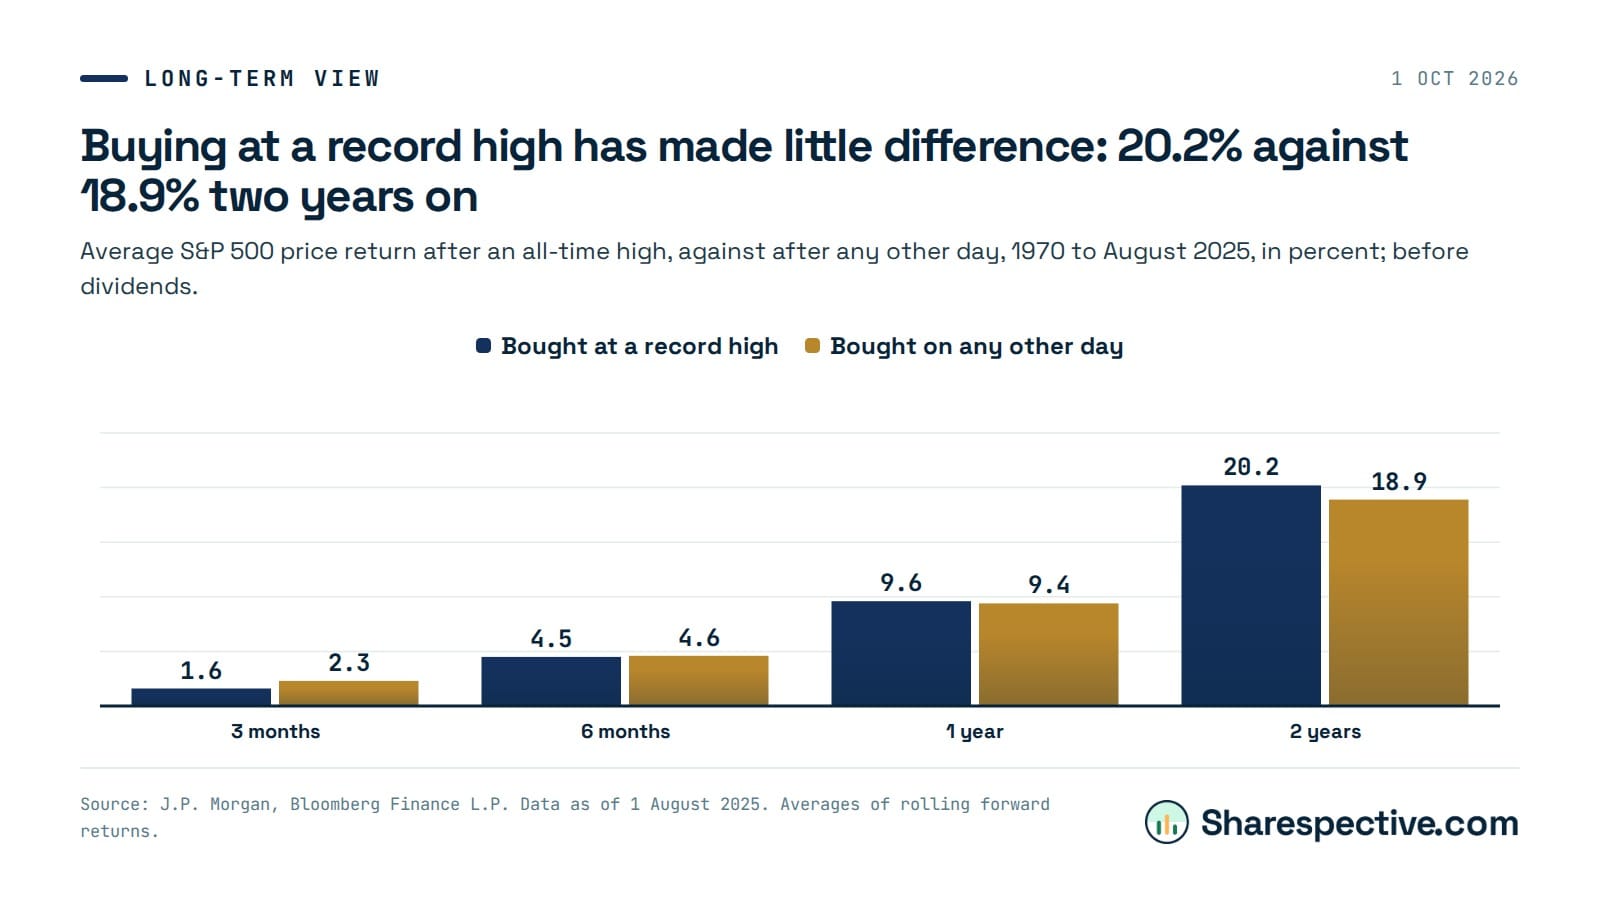
The best days rarely arrive on calm weeks: six of the 10 best came within two weeks of the 10 worst. Selling after a scary day is how most people miss them. The past guarantees nothing, but this is the case for sitting still.
The numbers
$10,000 in the S&P 500 from 2006 to 2025, dividends reinvested. Six of the 10 best days came within two weeks of the 10 worst.
| Value | A year | |
|---|---|---|
| Fully invested | $80,619 | +11.0% |
| Missed the 10 best days | $35,866 | +6.6% |
| Missed the 20 best days | $21,177 | +3.8% |
| Missed the 30 best days | $13,826 | +1.6% |
| Missed the 40 best days | $9,462 | −0.3% |
| Missed the 50 best days | $6,763 | −1.9% |
| Missed the 60 best days | $4,966 | −3.4% |
How we make these charts: drawn from the sources named on the chart, and checked against them before it is published. General information only, not financial advice.